NEXSPC 4.0 evolves traditional static quality reports into an intelligent visual command center. We know that in a fast-changing shop floor, time is cost. Thus, we developed a real-time architecture with ultra-low latency and high information density, aiming to break the information barrier between production and management.
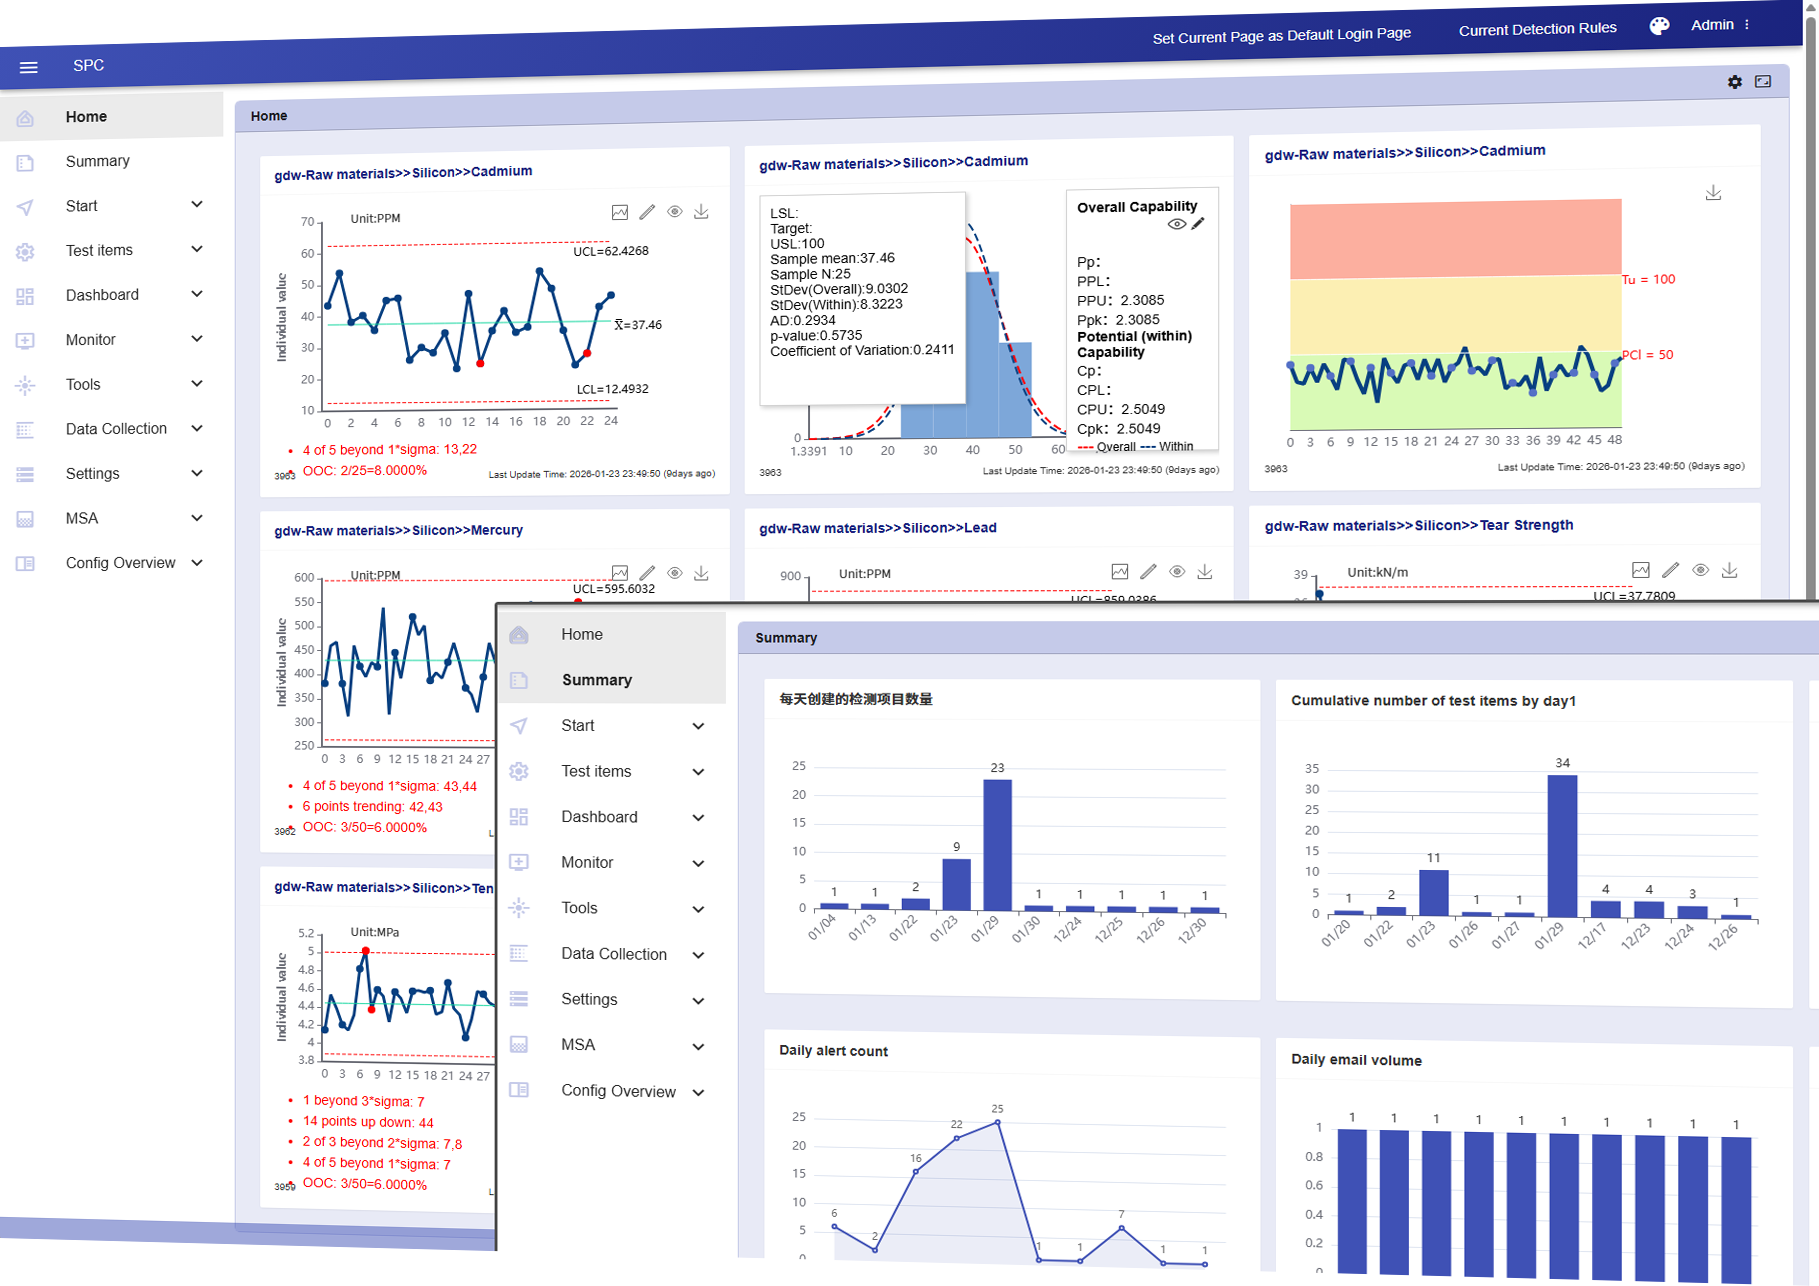
NEXSPC 4.0 Dynamic Dashboard is the 'central nervous system' of shop floor quality. Using Web WebSocket/SSE push technology, it syncs data inflow with graphic rendering. Breaking report lag, it ensures every data point triggers statistical calculation and visual feedback in seconds. Flexible config transforms inspection points into intuitive visual flows, capturing quality fluctuations at their inception.
As new data enters, the engine completes rule checks in milliseconds. The frontend SPC chart auto-recalculates and extends smoothly. No manual refresh needed—truly 'what you see is what you get' real-time monitoring.
Monitoring isn't limited to single charts. Combine SPC charts, CPK histograms, Box Plots, and sampling stats freely. Achieve a full perspective from trend monitoring to distribution assessment within one dashboard.
Powerful real-time filtering allows comparative analysis of data from different devices, batches, suppliers, or shifts. More than monitoring, it's a real-time benchmarking tool to quickly identify sources of variation.
Designed for limited space or big screens. Supports scrolling playback of multiple dashboards across projects and workshops. Customizable frequency ensures full coverage of all KPCs on a single display.
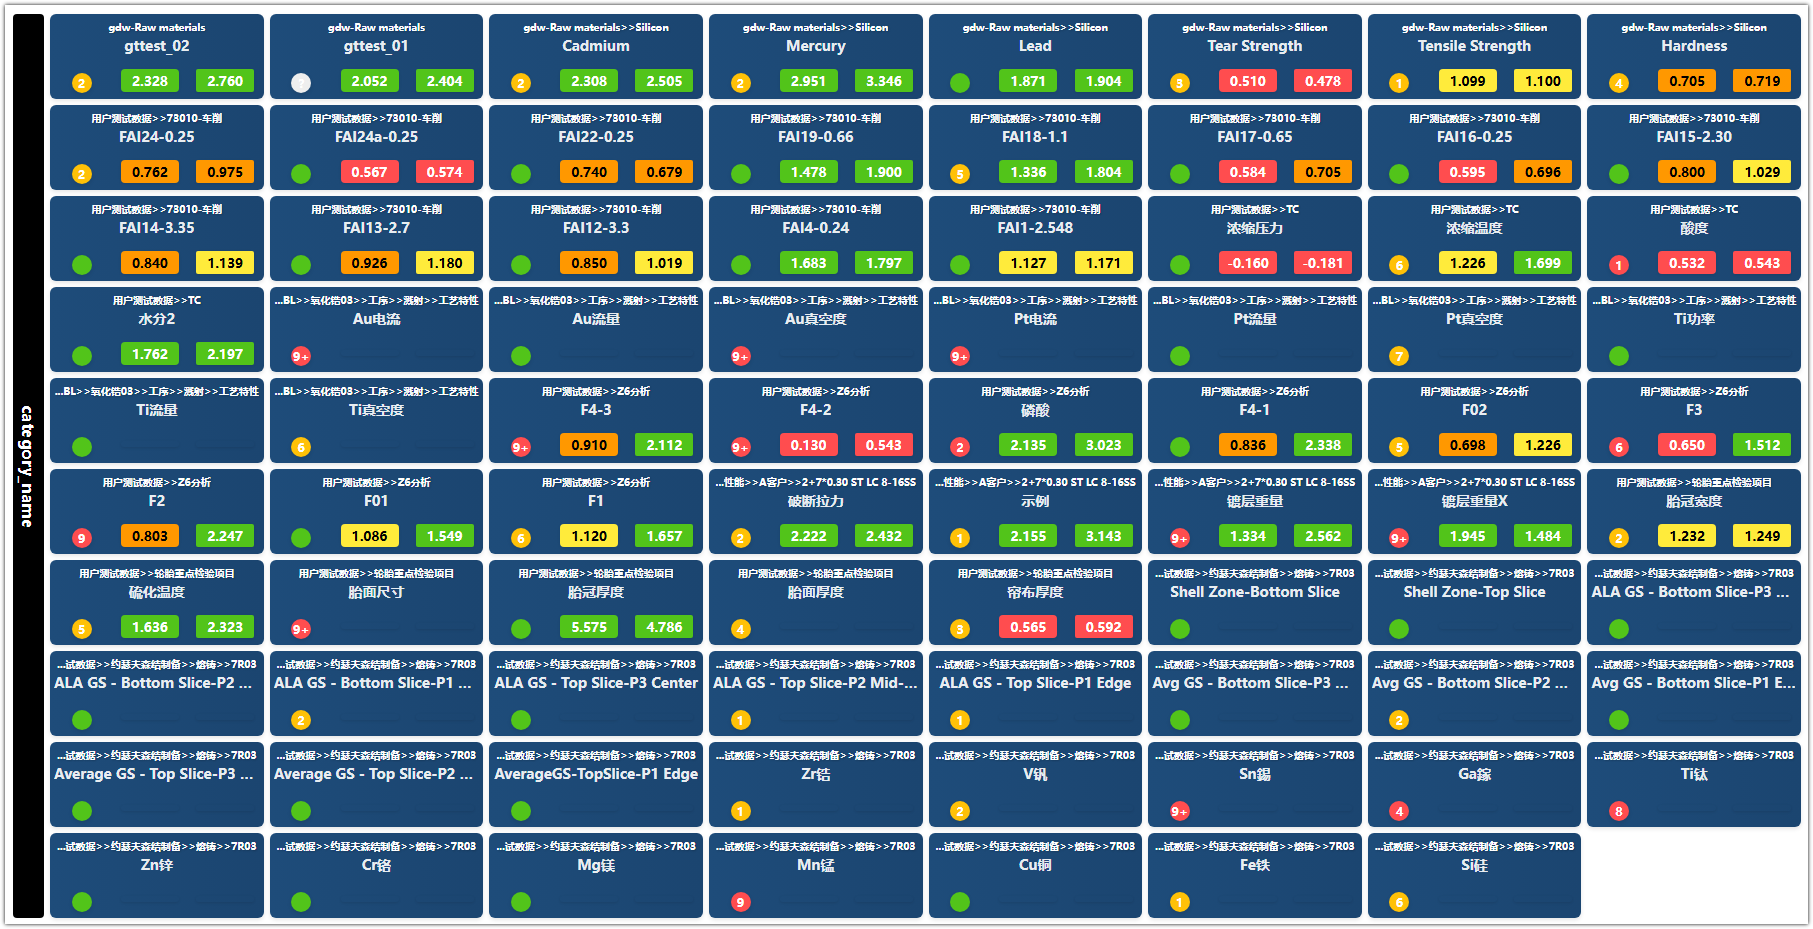
If Dynamic Dashboard is a 'deep X-ray', Comprehensive Dashboard is the 'Bird's-eye View' of factory quality. Designed for large-scale monitoring, it solves the pain of scattered points. Using Card Layout, it condenses massive real-time status into a compact space, helping managers pinpoint anomalies globally. It shifts management from 'seeking data' to 'data seeking you'.
Unlike curve tracking, this hits the core of quality. It filters noise, scanning for Out-of-Control (OOC) points and CPK/PPK levels. This result-oriented mode lets managers instantly lock onto red warning cards without checking every curve.
Thanks to high-performance card architecture, a single screen monitors over 100 items. With smart pagination and search, even thousands of KPCs remain clear, drastically reducing the pressure of monitoring large-scale multi-project analysis.
Each card has an engine changing color by metrics: Green (Stable), Yellow (Risk), Red (Anomaly). This visual hierarchy lets decision-makers instantly filter priorities in a data forest, creating an efficient quality command center.
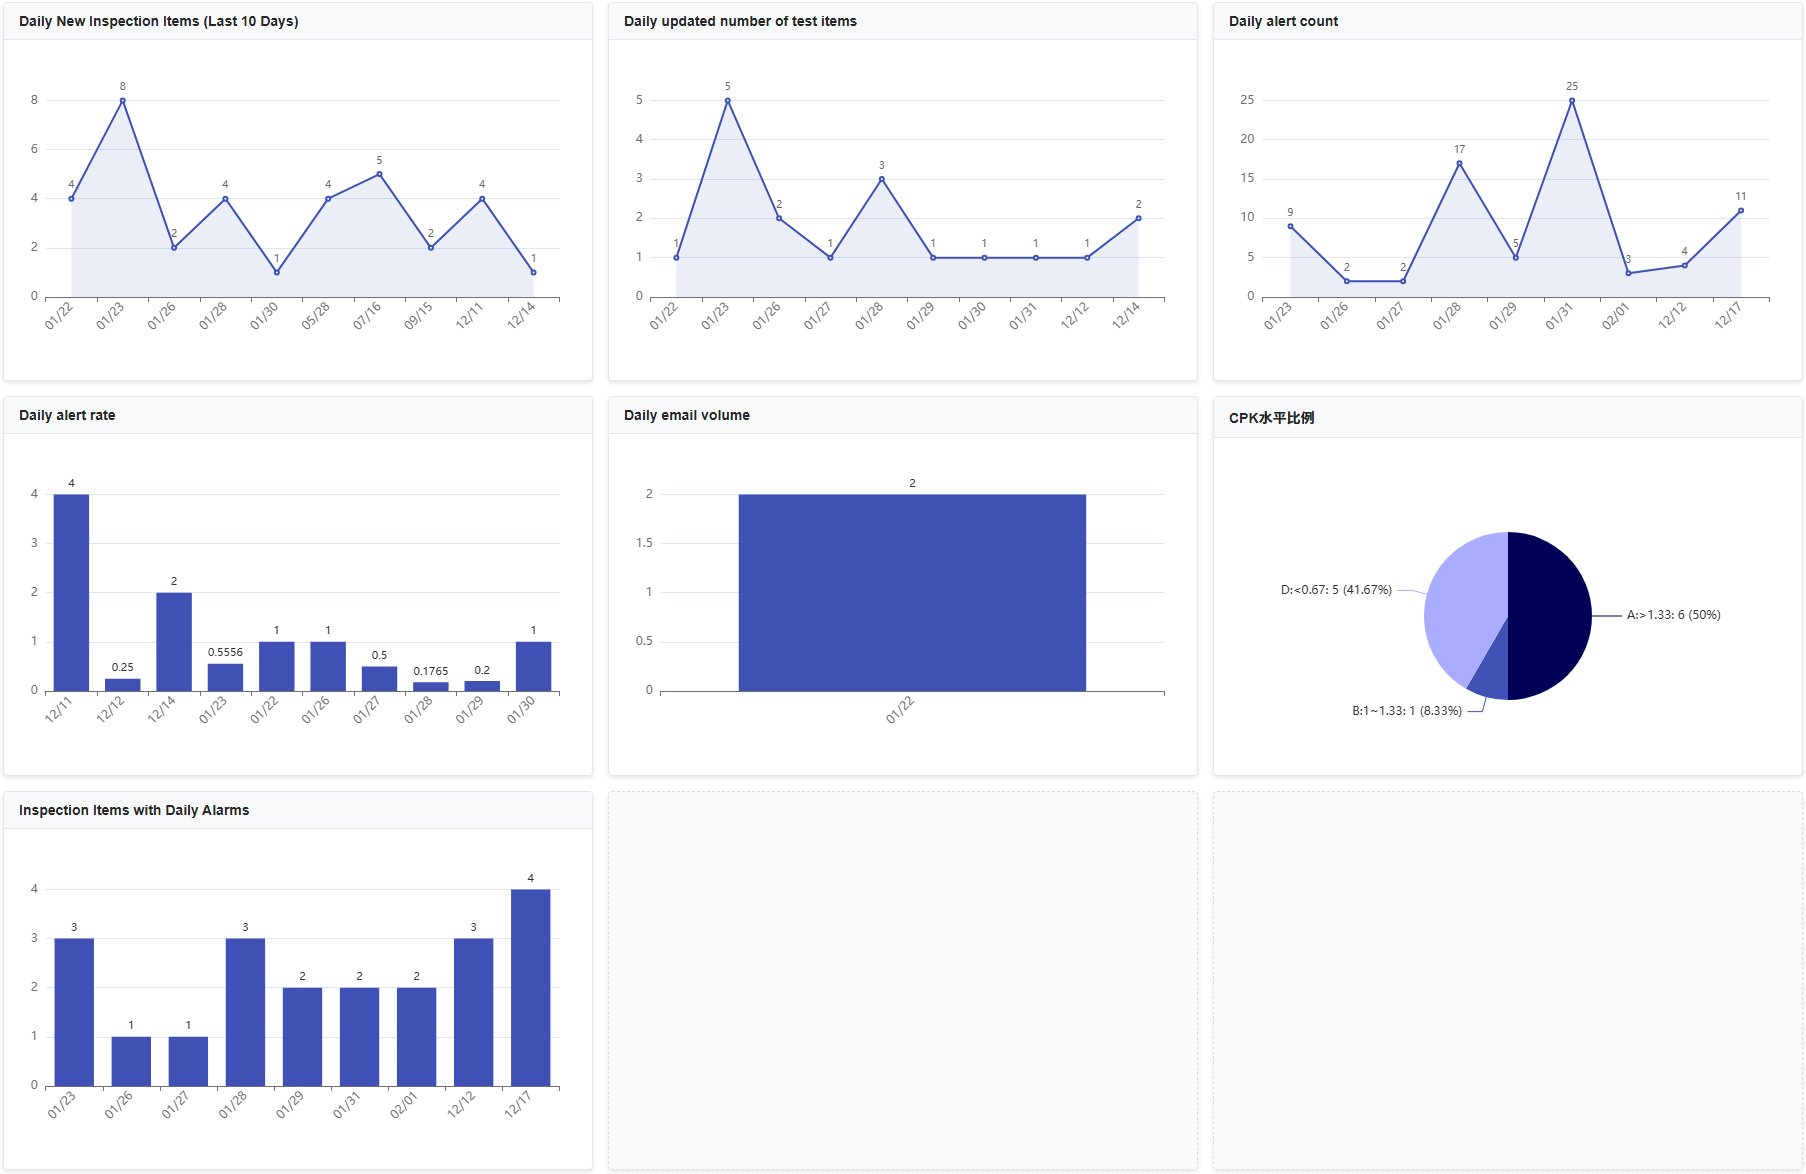
If other dashboards are 'scalpels', Statistical Dashboard is the 'Radar Station'. Moving beyond single items, it measures overall production quality. Using a powerful Custom SQL Engine, it breaks data silos, turning factory performance into intuitive charts. From CPK grade distribution to daily alert trends, it provides high-dimensional support, evolving management from 'post-event stats' to 'data-driven strategic insight'.
NEXSPC 4.0 grants extreme config freedom. With flexible SQL custom reports, define dimensions freely: across devices, workshops, or globally. From complex CPK grade ratios to multi-project anomaly comparisons, just one line of SQL generates your exclusive statistical dashboard.
Designed for leadership. Easily count daily alerts, monitor CPK Grade-A trends, or analyze business unit compliance. This trend analysis lets managers control stability macroscopically, identifying systemic risks for true lean quality management.
Powerful yet interactive. Drag and drop SQL-generated bars, pies, and lines to build decision screens fitting your management process. This high customization ensures hierarchical information flow, giving every manager tier immediate access to valuable insights.
NEXSPC 4.0 breaks the 'one-size-fits-all' mold, letting users define their homepages. Through innovative component config, engineers or team leaders can pick and 'pin' charts from massive libraries to their personal home. This human-centric design ensures every employee instantly locks onto KPCs relevant to their specific role upon login.
No longer limited by fixed layouts. Combine live Xbar-R charts from Dynamic Dashboards with factory CPK pies from Statistical Dashboards on one page. This integration removes page switching, letting you grasp micro fluctuations and macro trends simultaneously.
Simple 'Follow' mechanism. One click adds any real-time chart or SQL report to your cockpit. This flexible UI customization boosts efficiency, keeping core KPIs always in sight.
Your homepage is a personal alert station. By subscribing to specific charts, build a 'Watch List'. With silent monitoring, strong alerts trigger only when YOUR cared-for items show anomalies or CPK issues, enabling true precision quality management.


