High-end SPC for Wafer Fabrication & OSAT. Solving challenges in non-normal distribution fitting, Multi-Head consistency, and real-time monitoring of massive ATE data streams.

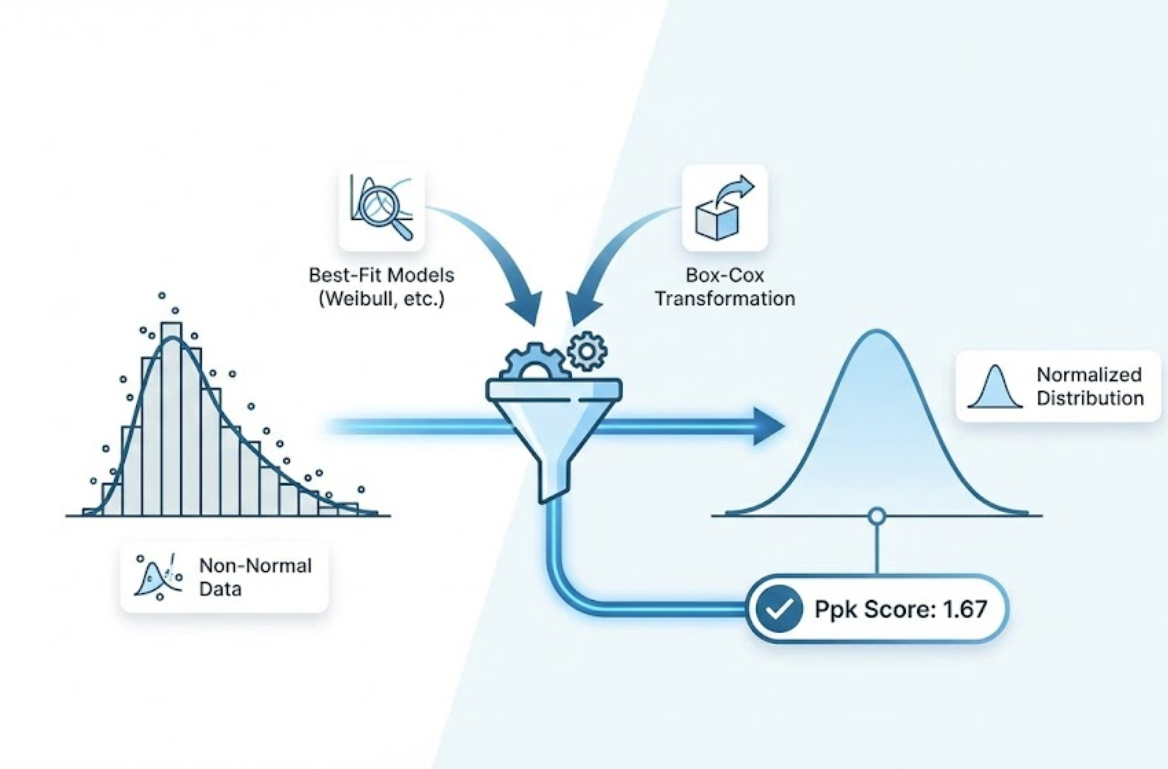
Process parameters like Etching Depth, Film Thickness, and Flatness often show Skewed distributions. Traditional SPC forces normal distribution formulas for CPK, causing massive False Alarms. Engineers are exhausted chasing ghosts.
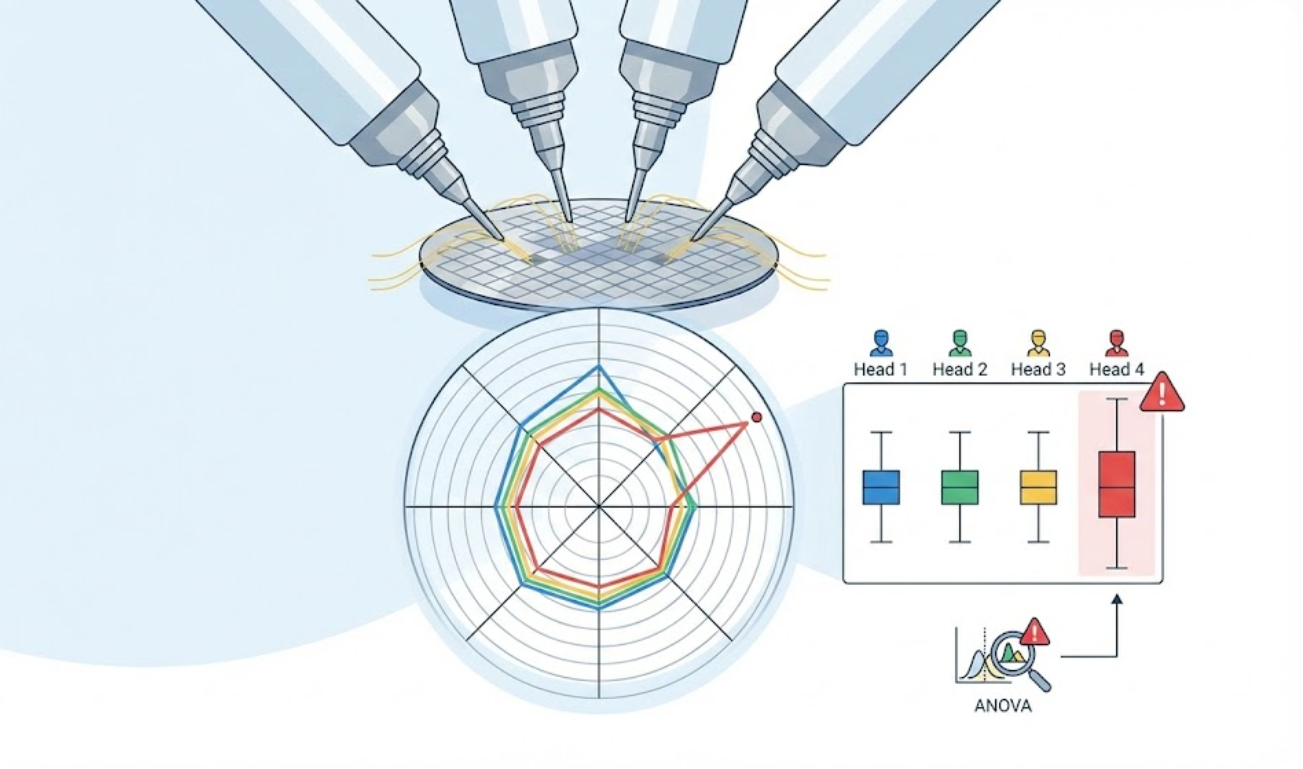
Die Bonders and Wire Bonders often have multiple nozzles or bond heads. A common scenario: 'Overall Machine CPK is fine, but one head is producing scrap.' Traditional charts fail to spot local anomalies.
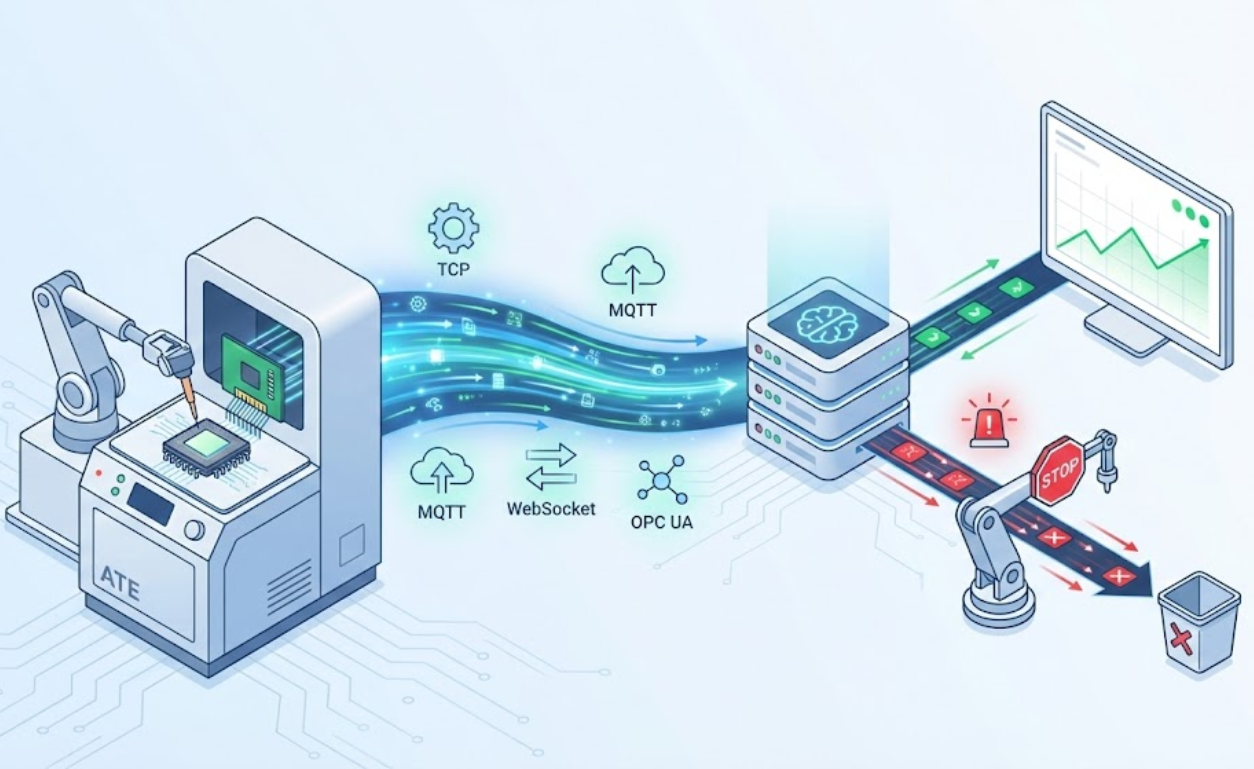
Automatic Test Equipment (ATE) generates thousands of results per second. Manual export and analysis lag behind, failing to intercept ongoing batch failures.
Bring the semiconductor's 'true distribution, true consistency, and true timeliness' back into statistical models and the engineering closed-loop.
Statistical Accuracy
Reveal the true face of data; reject mathematical model misjudgments. NEXSPC includes an advanced statistical toolbox specifically for the non-normal data prevalent in semiconductor processes.
 Head 7 error
Head-to-Head
Monitor every gold wire; miss no 'weak link' bond head. For multi-channel equipment like Wire Bonders and Die Attachers, NEXSPC offers multi-dimensional group control charts and comparative analysis.
 100+ Points/Sec Concurrent Writes
WEB API / MQTT / WebSocket / OPC UA
Keep pace with the tester's beat; achieve 'Analyze as Tested'. Facing massive data throughput in OSATs, NEXSPC adopts lightweight industrial protocols and high-concurrency write architecture.

Data Correlation & Root Cause Analysis
Trace effect to cause; find Key Control Characteristics (KCC). Yield dropped: was it temperature or pressure? NEXSPC links front-end process parameters to Final Test yield in a single 'data causality chain'.
From distribution models to data timeliness and analysis depth: every item directly impacts yield and cost.
| Dimension | Traditional Excel / Generic SPC | NEXSPC Semiconductor Edition |
|---|---|---|
| Distribution Model | Defaults to Normal Distribution. CPK calculation error for non-normal data. | Auto-fits Weibull/Log-Normal. Ppk error <1%. <1% |
| Multi-Head Management | Only sees overall equipment capability, masking bad head issues. | One-click Group Comparison & Box Plot for Multi-Head/Nozzle. Pinpoint weak Heads. |
| Data Timeliness | Export ATE reports daily/per shift. Only 'Post-Mortem Checks'. | MQTT Sub-second Collection. Real-time 'Health Check' & Interception. |
| Analysis Depth | Limited to plotting charts. | Offers Six Sigma tools: ANOVA, Regression, Auto-Lag. |
Understood our solutions? Are you ready? Click the button on the right to View Pricing or Consult Now.


