NEXSPC 4.0 provides modern manufacturing enterprises with a digital analysis engine benchmarking international statistical standards. We deeply integrate a full matrix of control charts, from Variable (I-MR, Xbar-R, Xbar-S) to Attribute (P, NP, C, U) types, ensuring optimal monitoring logic for both discrete manufacturing and process industries.
The Complete Chart Library
NEXSPC 4.0 boasts deep statistical capabilities benchmarking Minitab, offering a chart matrix covering all manufacturing scenarios. Whether for discrete or continuous production, NEXSPC delivers professional-grade real-time monitoring via the Web, ensuring no quality fluctuation goes unnoticed.
Variable Control Charts
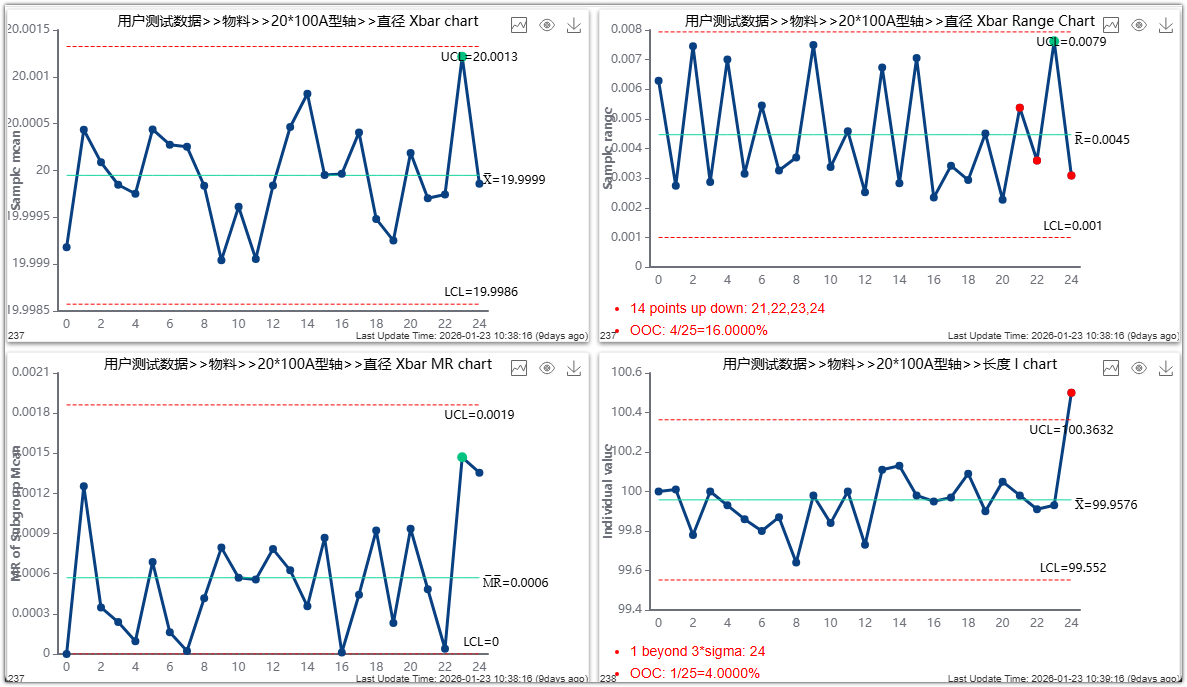
I-MR (Individual-Moving Range): For small batches, expensive testing, or slow production cycles.
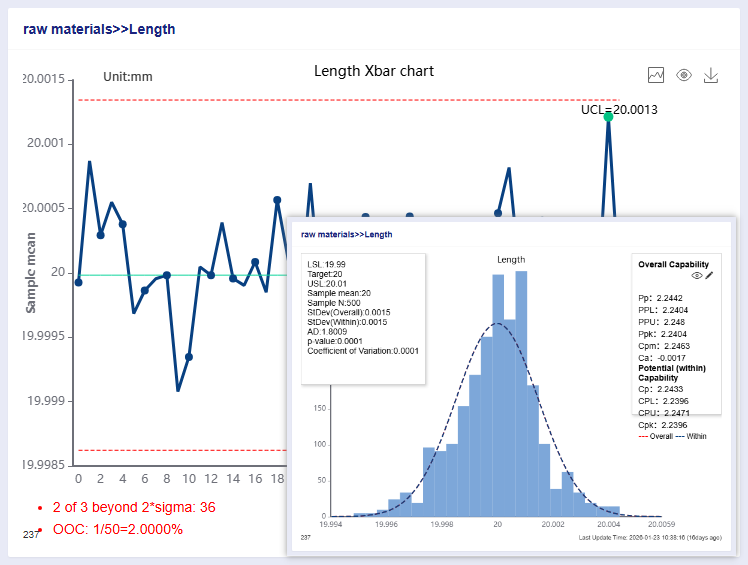
Xbar-R (Mean-Range): The classic tool for subgroup analysis.
Xbar-S (Mean-StDev): For precise monitoring with large subgroup sizes.
MR-R/S (Between/Within): Deep analysis of variation within and between subgroups.
Attribute Control Charts
P / NP Charts: Monitor defectives rate and count (rejects).
C / U Charts: Monitor defect count and defects per unit.
Automated CPK/PPK Study
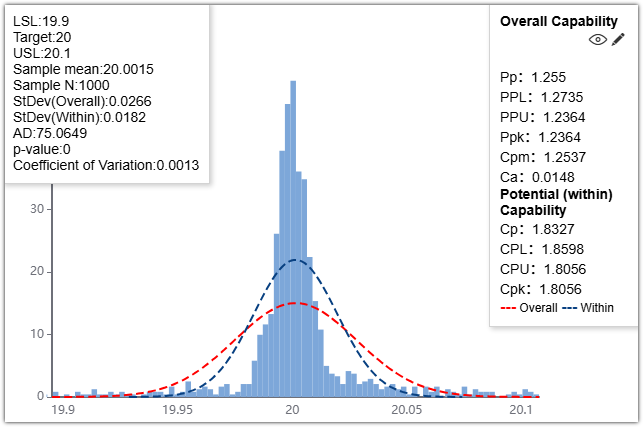
NEXSPC 4.0 transforms complex capability calculations into instant automated outputs. It calculates core metrics like CPK, PPK, CPU, CPL, and StdDev in real-time, integrated with Normality Tests and Distribution Fitting to ensure statistical rigor. With dynamic specification lines (USL/LSL/Target), histograms and normal distribution curves render synchronously with data flow, helping you precisely assess process stability and spec matching. Get professional reports benchmarking international standards with one click—no manual data prep required.
Multi-dimensional Metrics: Real-time output of CPK, PPK, CPU, CPL, Mean, and StdDev.
Dynamic Analysis: Process capability indices recalculate in real-time as new data flows in, keeping quality managers updated on stability.
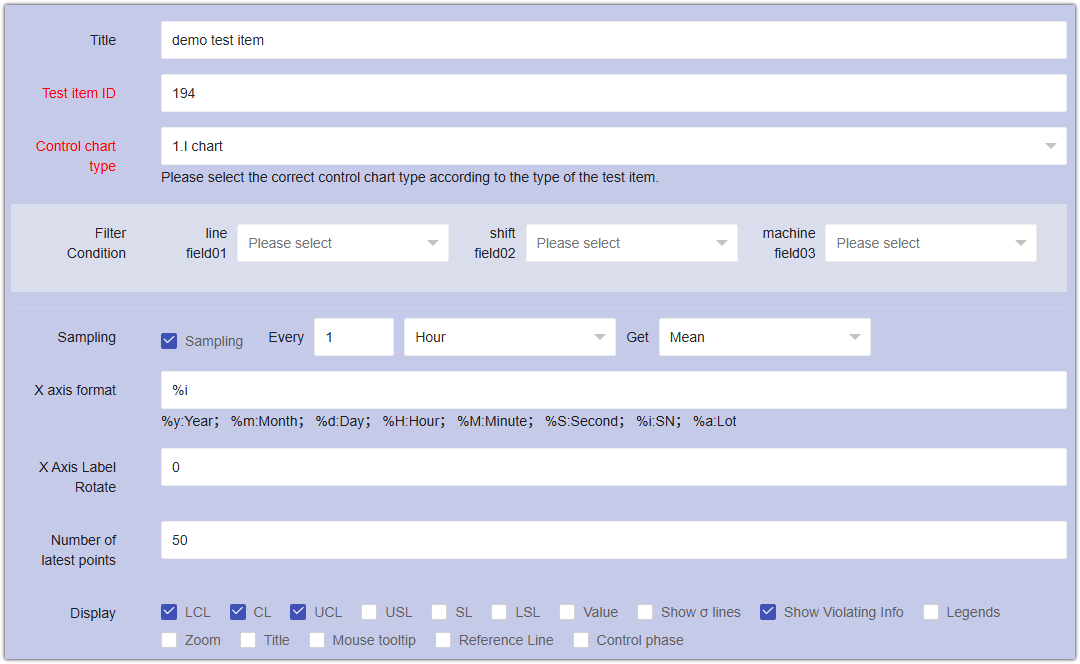
Spec Management: Supports Target, USL, and LSL settings, automatically rendering capability curves on histograms based on specs.
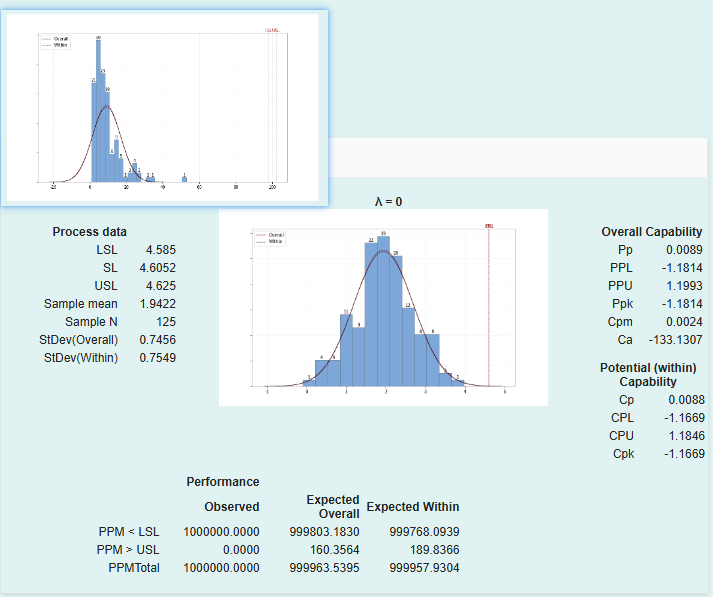
Non-normal data processing: Box-Cox intelligent transformation
In real industrial scenarios, not all quality data forms a perfect bell curve (normal distribution). Data often shows significant skewness, especially involving GD&T (like flatness, roundness), impurity content, or cycle times. NEXSPC features built-in professional Box-Cox transformation to easily tackle non-normal data challenges.
Automated Normality Test: Before process capability analysis, the system executes a 1-click normality test (Anderson-Darling) to scientifically determine data distribution characteristics.
Dynamic Box-Cox Transformation: When data is non-normal, NEXSPC supports 1-click Box-Cox transformation. The system automatically finds the optimal $\lambda$ (Lambda) value to convert skewed data into normal data.
Value: Ensures absolute accuracy of CPK/PPK. Avoids yield over/underestimation caused by incorrect distribution assumptions. Generates professional capability reports fully compliant with IATF 16949 / PPAP audit standards, eliminating the need for tedious manual conversions in third-party software.
Enhanced Tools
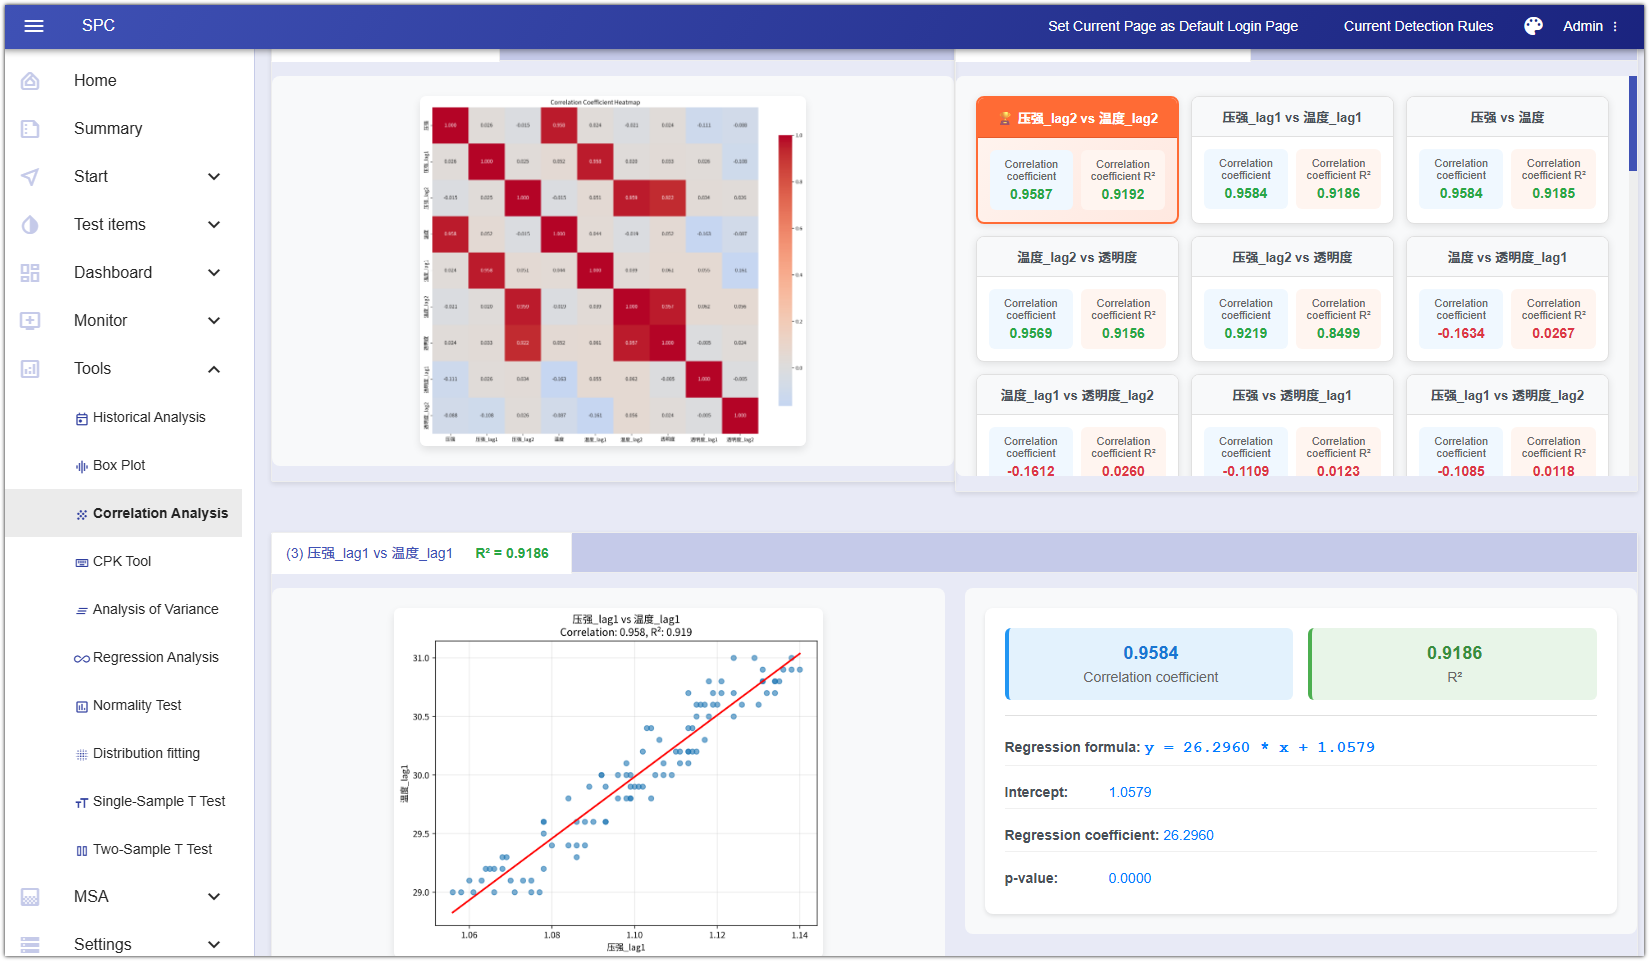
NEXSPC 4.0 goes beyond charting; it is a deep quality decision engine. Beyond standard SPC, it integrates correlation analysis, regression, normality tests, and various T-tests for research-grade root cause tracing. Advanced distribution fitting ensures statistical accuracy, while ML anomaly plots capture subtle trend shifts. Innovative AI LLM interpretation transforms complex metrics into easy-to-understand diagnostic advice, letting data truly drive management decisions.
Data Summary & Fitting: Automated normality tests ensure the prerequisites for SPC analysis are met.
ML Anomaly Plot: Combines trend analysis to assist in identifying potential process shifts.
LLM AI Diagnosis: Uses built-in AI to interpret CPK trends in text, auto-identifying 'Common Cause' vs 'Systematic Shift'.
Advanced Data Handling
NEXSPC 4.0 empowers users with exceptional control over production data, making complex cleaning and screening effortless. It supports outlier exclusion, allowing manual marking and removal of measurement errors or equipment noise to ensure analysis authenticity. Built-in powerful multi-dimensional slicers support dynamic filtering by time, batch, process, device, or personnel, helping you quickly compare process performance. All results can be exported as HD images or PDF reports with one click, seamlessly bridging raw data to professional reporting, drastically boosting efficiency.
Outlier Management: Supports manual marking and exclusion of abnormal interference data to ensure analysis remains uncontaminated.
Data Filtering & Slicing: Quickly filter data by batch, shift, device, and other dimensions for targeted capability analysis.