


From a Statistical Toolbook to a Globally Harmonized Process Control Standard
In February 2026, the latest edition of the AIAG–VDA SPC Manual (Yellow Volume) was officially released by AIAG and VDA.
This update represents one of the most significant evolutions in the history of Statistical Process Control (SPC). Rather than a routine revision, the 2026 edition reshapes SPC from a collection of statistical tools into a harmonized, globally aligned framework for process governance.
For manufacturers operating in complex, multinational supply chains, this shift carries strategic implications.

Why This Update Matters
For decades, SPC has been central to quality control. However, previous implementations often faced challenges:
- Differences between AIAG and VDA interpretations
- Inconsistent definitions of capability and performance indices
- Limited integration with FMEA, MSA, and Control Plans
- Overreliance on Cp/Cpk without confirming statistical control
- Weak alignment with digital manufacturing environments
The 2026 AIAG–VDA edition addresses these gaps directly by:
- Harmonizing terminology and definitions
- Clarifying index interpretation and prerequisites
- Expanding guidance on control chart selection
- Strengthening integration with modern quality systems
SPC is no longer positioned as a charting exercise — it is framed as a structured decision-making system for managing process risk.
Key Differences Between Previous and 2026 Editions
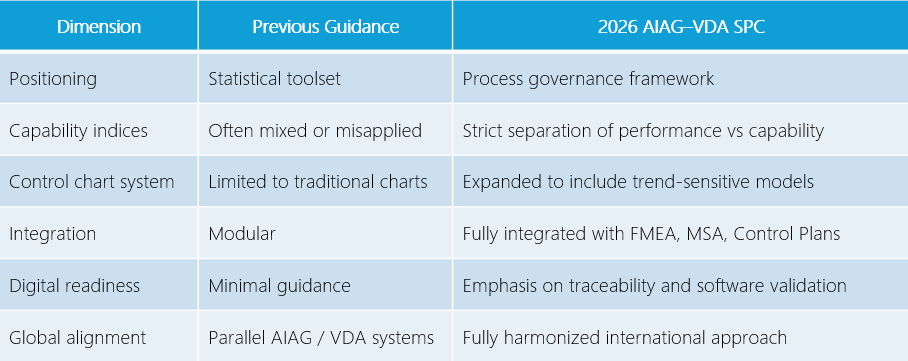
Major Structural Changes in the 2026 Manual
1. Full Harmonization
The 2026 edition represents the most comprehensive integration between AIAG and VDA to date.
It establishes:
- Unified terminology aligned with ISO standards
- Clear and consistent definitions of capability indices
- A single reference framework for global suppliers
This reduces the need for organizations to interpret OEM-specific variations and supports standardized implementation across regions.
2. Clear Separation of Performance and Capability Indices
One of the most impactful updates is the strict differentiation between three index categories:
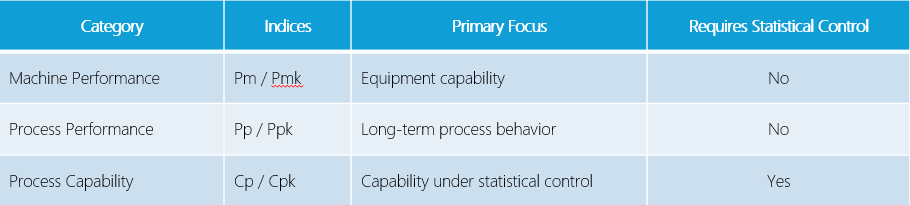
The manual reinforces a critical principle:
Cpk is only meaningful when the process is statistically stable.
Calculating Cpk without demonstrating control is explicitly discouraged.
This clarification addresses one of the most common misuses of SPC in practice.
3. Expanded and Structured Control Chart Selection
The 2026 edition strengthens guidance on selecting appropriate monitoring methods based on process behavior.
Beyond traditional X̄-R and I-MR charts, it emphasizes:
- EWMA for gradual process drift
- CUSUM for small, sustained shifts
- Improved guidance for attribute charts
- Alignment with time-series thinking
This represents a shift from static 3σ rule detection toward more nuanced trend recognition.
SPC is positioned as a predictive monitoring tool — not merely a reactive detection mechanism.
4. Integration with Core Quality Tools
The updated manual embeds SPC within a broader quality management structure:
- Alignment with FMEA risk analysis
- Direct linkage to Control Plans
- Reinforcement of MSA prerequisites
- Clear expectations for OCAP (Out-of-Control Action Plans)
- Support for PDCA and continuous improvement cycles
This systems-level integration transforms SPC into a governance component rather than an isolated statistical task.
5. Digitalization and Data Governance Emphasis
The 2026 edition acknowledges modern manufacturing realities:
- Automated data collection
- Real-time monitoring systems
- Software-assisted analysis
- Traceability and audit readiness
It highlights the need for:
- Validated SPC software tools
- Data integrity and retention
- Transparent documentation
- Structured reporting
SPC is now explicitly linked to digital manufacturing maturity.
Practical Implications for Manufacturers
✔ Stronger Control Before Capability
Organizations must demonstrate statistical control before reporting Cp/Cpk.
This may require revisiting historical capability studies.
✔ More Strategic Chart Selection
Control charts must reflect process behavior, not habit.
For drift-sensitive or high-precision processes, EWMA and CUSUM may become standard practice.
✔ Reduced Misinterpretation of Indices
The separation of Ppk and Cpk eliminates ambiguity and improves communication with customers and auditors.
✔ Greater System Accountability
SPC results must align with:
- FMEA risk priorities
- Control Plan checkpoints
- Corrective action structures
This increases traceability and executive visibility.
Conclusion: SPC as a Governance Framework
The 2026 AIAG–VDA SPC Manual marks a structural evolution in statistical process control.
It moves the discipline:
- From chart drawing to risk management
- From isolated metrics to integrated quality systems
- From regional interpretation to global harmonization
Organizations that continue treating SPC primarily as a Cp/Cpk calculation exercise may face increasing challenges in audits and global supply chain alignment.
Those that adopt the updated framework will gain:
- Clearer statistical logic
- Stronger process predictability
- Improved cross-functional alignment
- Higher digital readiness
SPC is no longer just a statistical method — it is becoming a foundational language of process governance in global manufacturing.