


You may have noticed that when using Minitab to create Xbar-R and Xbar-S control charts, each is composed of a pair of charts:
- Xbar-R Control Chart includes: Xbar Control Chart and R Control Chart

- Xbar-S Control Chart includes: Xbar Control Chart and S Control Chart

So the questions arise:
- For the same data source, are the Xbar Control Charts in the Xbar-R and Xbar-S Control Charts the same?
- When should we use the Xbar-R Control Chart, and when should we use the Xbar-S Control Chart?
- How are the control limits of these control charts calculated?
This article provides the most detailed explanation available on the internet.
To clarify, the Xbar Control Charts in the Xbar-R and Xbar-S Control Charts are not the same. The use of Xbar-R Control Chart and Xbar-S Control Chart is conditional; we should not use Xbar-R and Xbar-S simultaneously on the same set of inspection data. Therefore, we do not need to worry about whether the Xbar Control Charts in Xbar-R and Xbar-S are the same, because we will not be using Xbar-R and Xbar-S at the same time.
For subgroup sizes ≤10
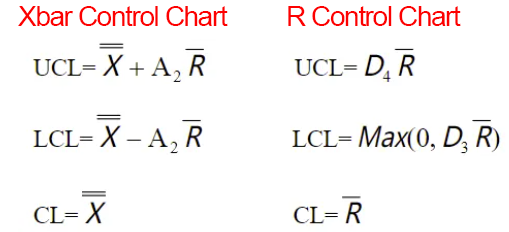
we need to use the Xbar-R Control Chart. The control limits for the Xbar Control Chart and R Control Chart are calculated as follows:

- Rbar: The average of the ranges of each subgroup
For subgroup sizes >10
we need to use the Xbar-S Control Chart. The control limits for the Xbar Control Chart and S Control Chart are calculated as follows:

- Sbar: The average of the standard deviations of each subgroup (Note: The standard deviation should be calculated with the denominator n−1)
The SPC constants such as A2, D4, A3, B4, etc., used in these formulas are as follows:
