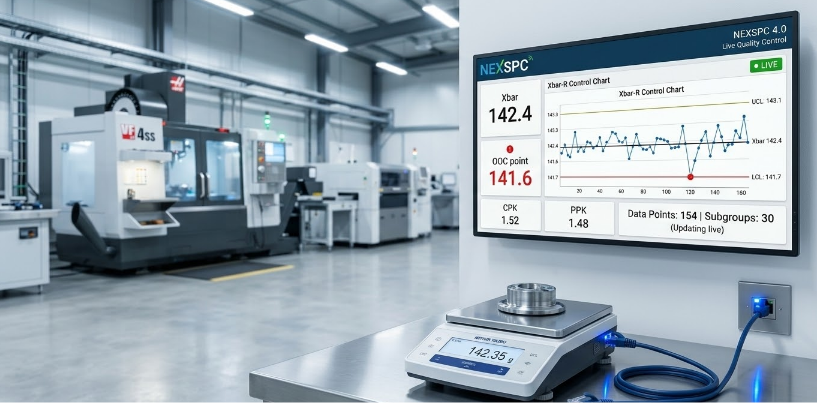
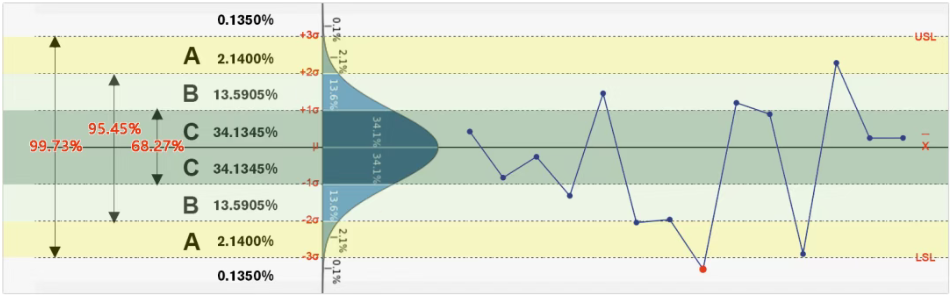
How to Calculate Control Limits for Xbar-R and Xbar-S Control Charts in SPC Analysis and When to Use Each Chart
This article provides an in-depth explanation of the calculation of control limits for Xbar-R and Xbar-S control charts in SPC analysis.…
Technical articles and insights on NEXSPC and Statistical Process Control (SPC).
This article provides an in-depth explanation of the calculation of control limits for Xbar-R and Xbar-S control charts in SPC analysis.…
This article discusses using SPC or a one-sample T-test to determine if batch product weights meet standards. It recommends the one-sample T-test for more reliable and accurate results.…
When discussing quality anomaly analysis, almost everyone familiar with the field will mention SPC (Statistical Process Control) control charts. Indeed, SPC control charts are currently the most widely used tool for quality anomaly analysis…
SPC is a widely used, easy-to-implement, and cost-effective analytical tool in manufacturing. It enhances product quality, process stability, and overall work performance through real-time monitoring, data-driven decision-making, and a focus on prevention…
In an SPC system, there is a significant amount of test data stored, and there might be correlations between test items from common sources.…