













Which SPC Control Chart Should You Choose? One Flowchart Explains Them All
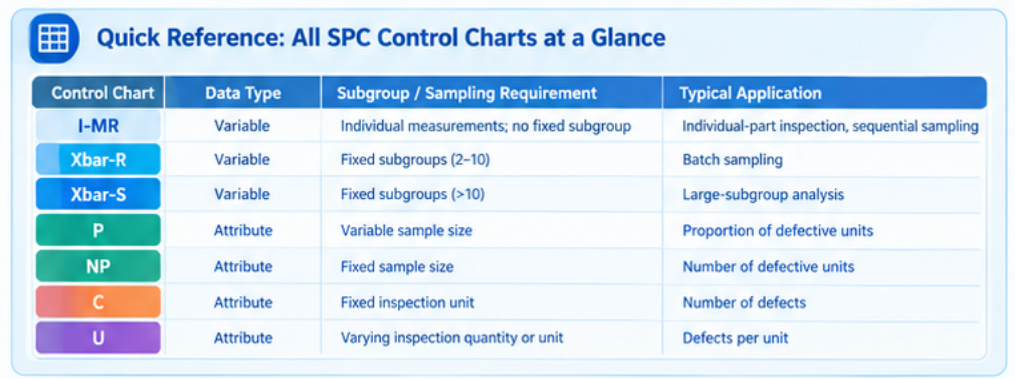
Learn how to choose the right SPC control chart for variable and attribute data. Compare I-MR, Xbar-R, Xbar-S, P, NP, C, and U charts with practical manufacturing examples.…
Technical articles and insights on NEXSPC and Statistical Process Control (SPC).
Keyword "SPC Control Chart" found 8 articles (current page)
Learn how to choose the right SPC control chart for variable and attribute data. Compare I-MR, Xbar-R, Xbar-S, P, NP, C, and U charts with practical manufacturing examples.…
Discover why many SPC implementations fail despite expensive software investments. Learn how structured manufacturing traceability, root cause analysis, and integrated SPC data help manufacturers improve quality, pass audits, and drive continuous improvement with NexSPC.…
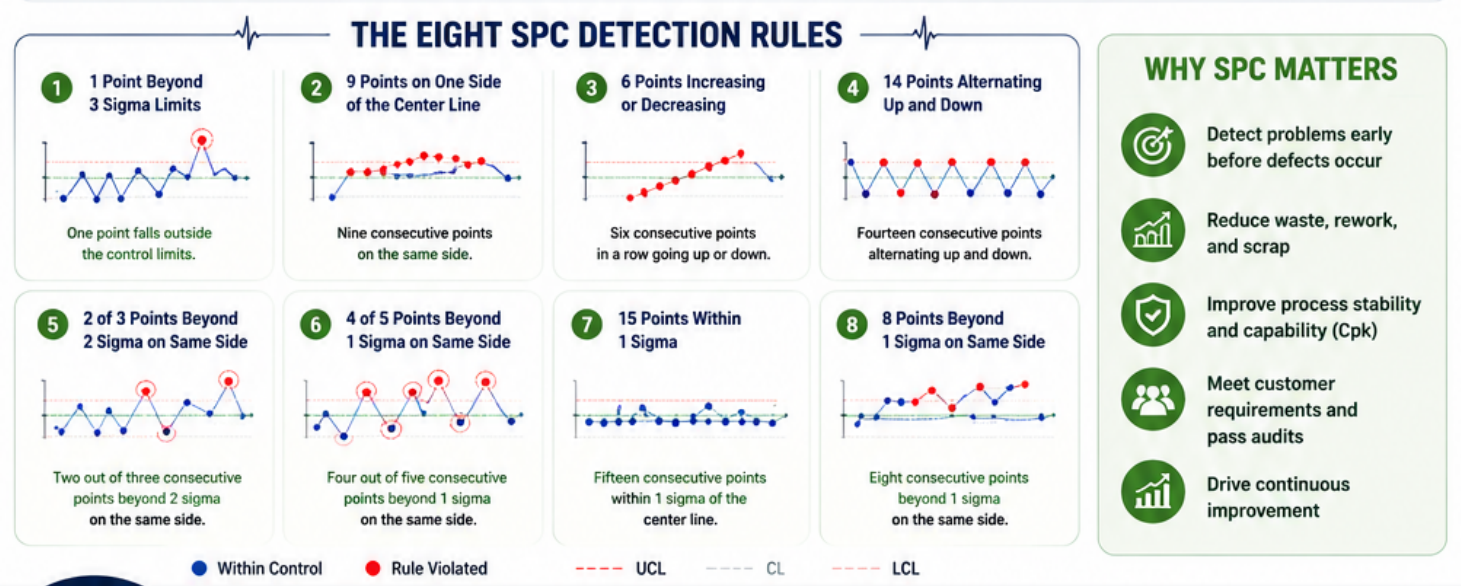
Learn what an SPC Control Chart is in three simple sentences. Discover how SPC uses control charts, normal distribution, the 3-sigma principle, and the eight detection rules to identify process abnormalities before defects occur.…
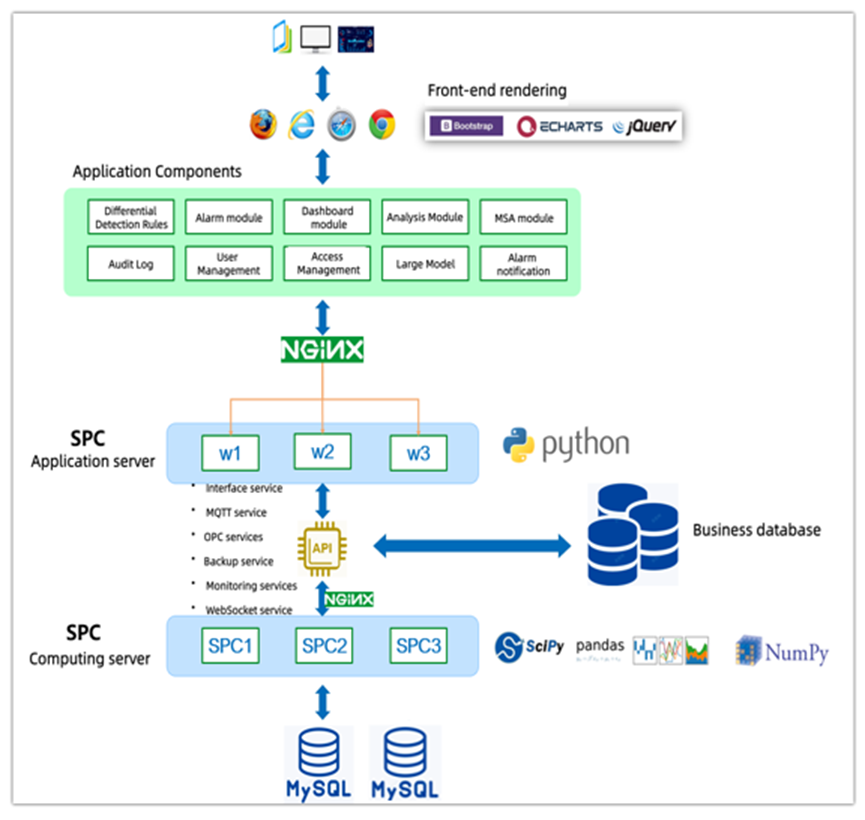
Discover how NexSPC Enterprise Edition achieves zero-downtime SPC monitoring through Active-Active MySQL replication, Keepalived failover, real-time file synchronization, Industrial IoT integration, and enterprise-grade high availability for smart manufacturing.…
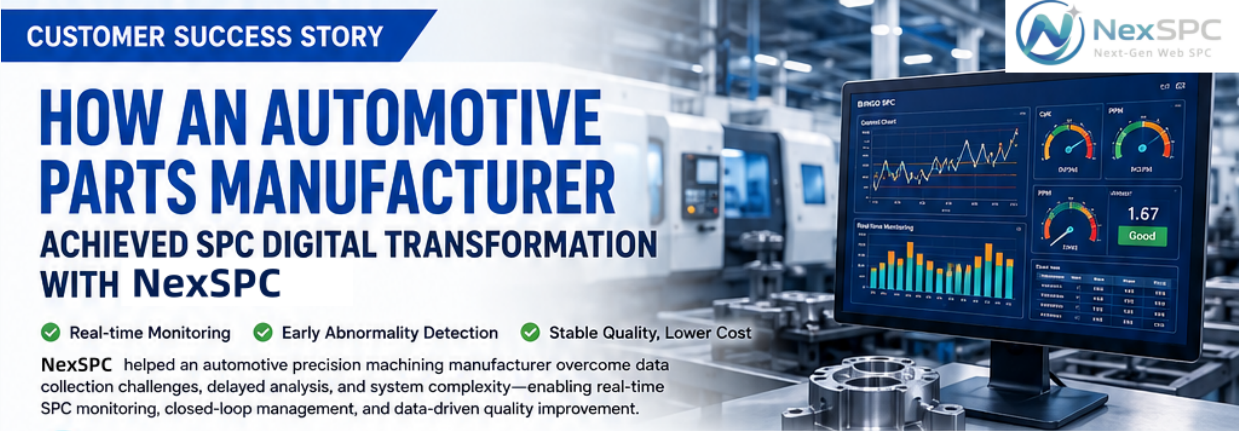
Learn how an automotive parts manufacturer improved process stability, accelerated abnormality detection, simplified customer audits, and achieved real-time SPC monitoring through a successful digital transformation with NexSPC.…
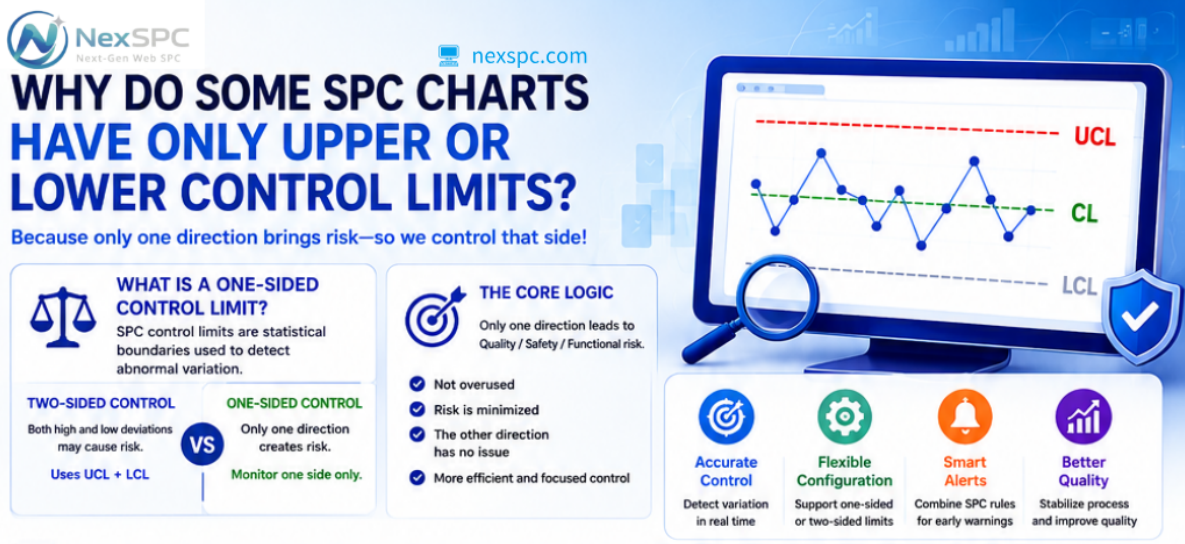
Some SPC control charts use only UCL or LCL because real industrial processes often require one-sided control. NexSPC supports flexible one-sided and two-sided control limit configuration.…
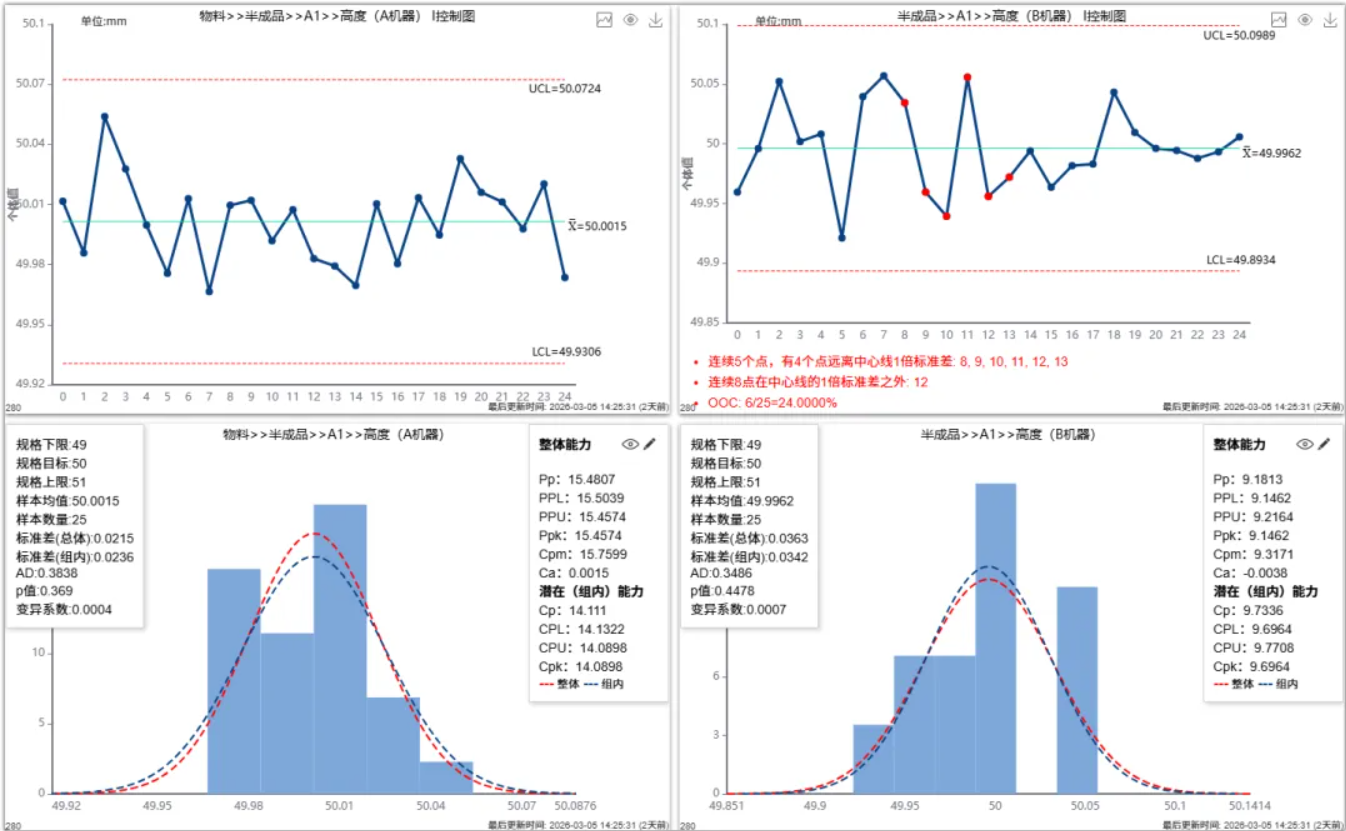
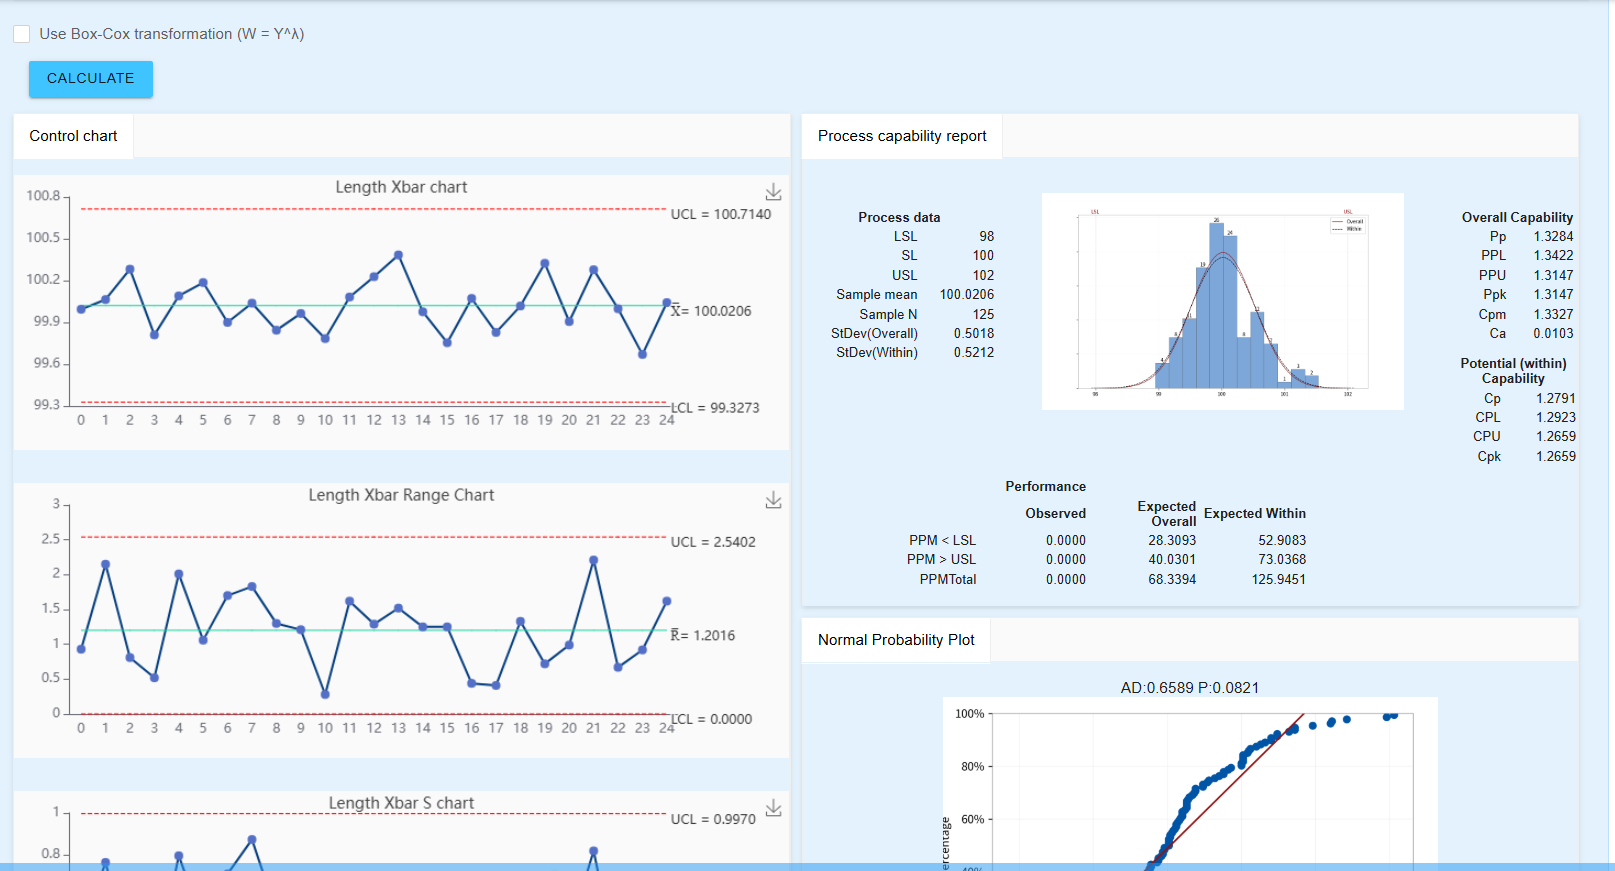
NEXSPC automates CPK calculation, SPC control charts, and rule violation analysis with real-time monitoring and one-click reporting.…
When discussing quality anomaly analysis, almost everyone familiar with the field will mention SPC (Statistical Process Control) control charts. Indeed, SPC control charts are currently the most widely used tool for quality anomaly analysis…