














Many manufacturers invest heavily in SPC systems, believing they are fully prepared for customer audits and quality certifications.
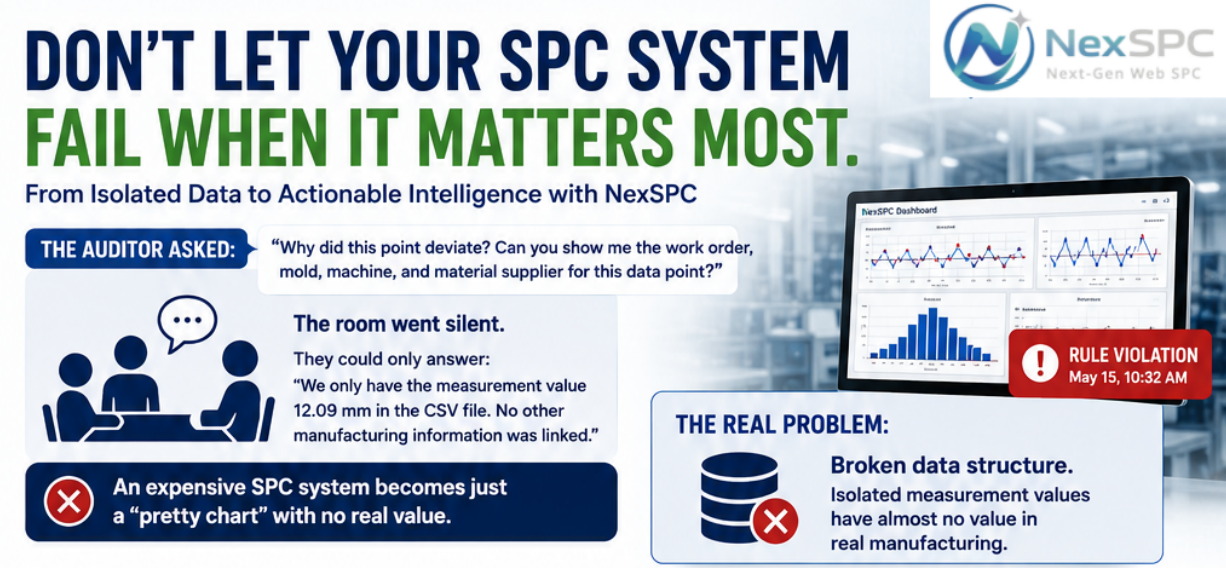
Then one day, during a supplier audit, the auditor stops in front of an SPC dashboard and points to a red alarm point that appeared last Wednesday.
He turns to the Quality Manager and asks:
"Why did this point deviate from the process average? Can you immediately show me the related work order, mold number, production machine, and raw material supplier for this data point?"
At that moment, the room falls silent.
The quality engineer starts digging through printed Excel reports.
The IT team rushes to cross-reference timestamps in the MES system.
After several minutes of confusion, someone finally responds:
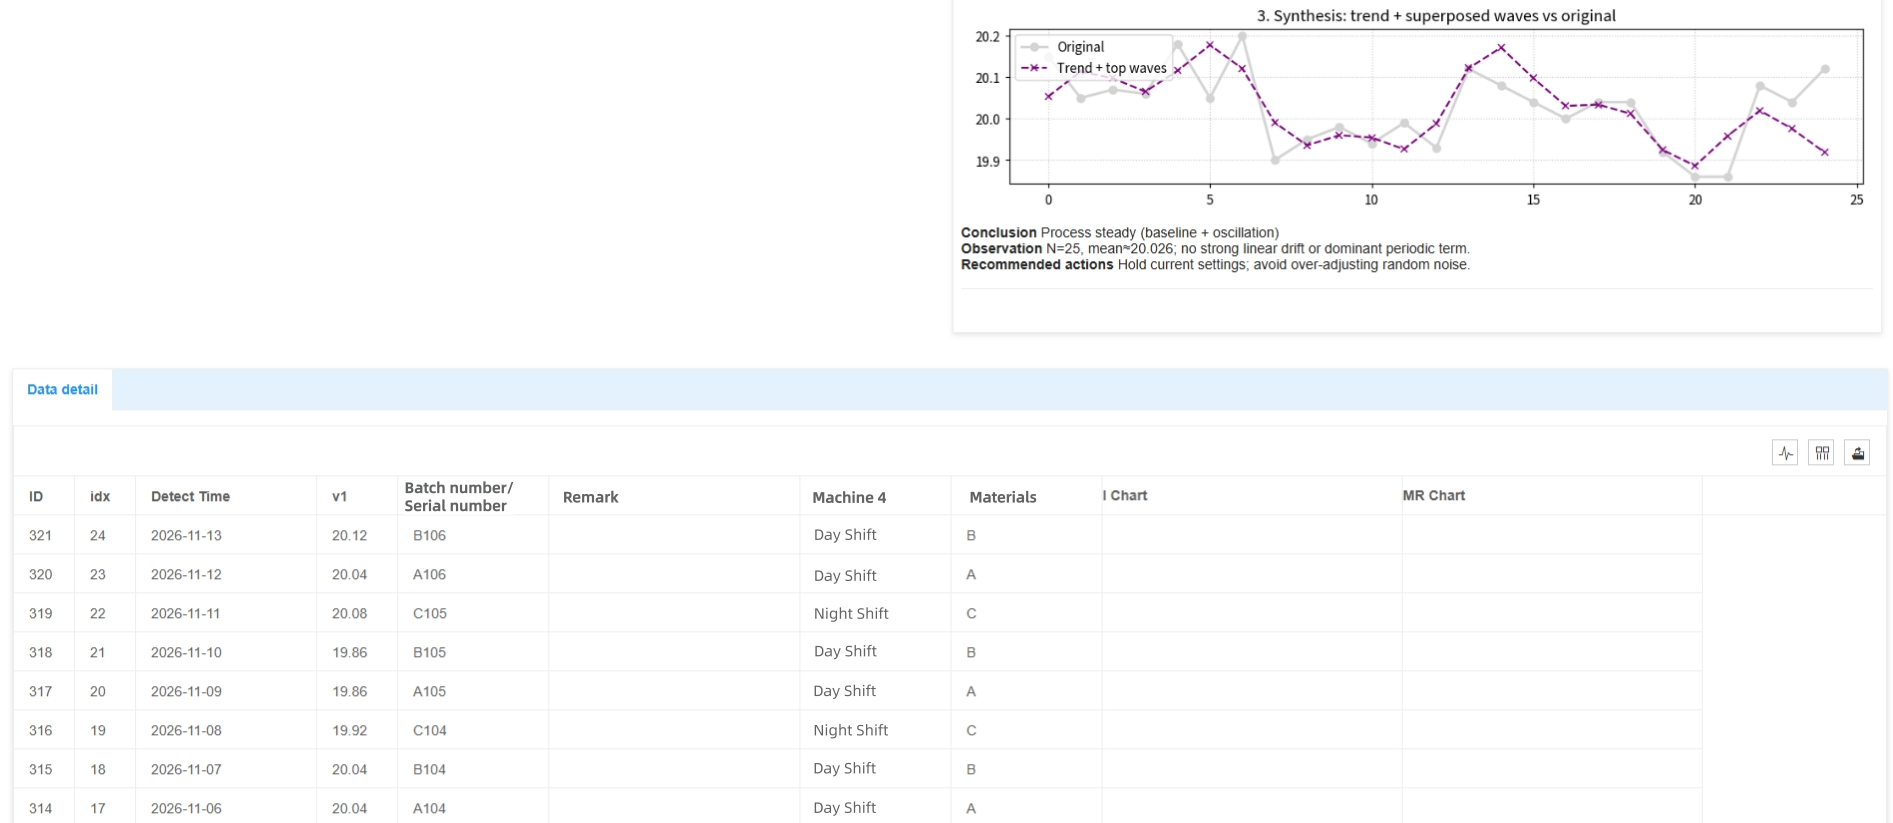
"The measuring device only recorded a value of 12.09 mm in the CSV file. The manufacturing background information wasn't linked at the time."
Suddenly, the SPC system that cost tens of thousands of dollars becomes nothing more than an expensive charting tool.
This is the harsh reality behind many failed SPC implementations.
The control charts may look impressive.
The dashboards may appear modern.
But when it's time to investigate process variation, pass a customer audit, or perform root cause analysis, the system provides no meaningful answers.
Why?
Because the SPC implementation failed at the most fundamental level:
The underlying data structure.
An isolated measurement value has almost no value in a real manufacturing environment.
Why an Isolated Measurement Value Is Practically Useless
Many companies believe implementing SPC simply means:
- Exporting measurement data from inspection equipment.
- Importing CSV or Excel files into SPC software.
- Generating control charts.
Job done.
Unfortunately, manufacturing reality is far more complex.
Imagine seeing a measurement value: 12.09 mm
Without context, this number tells you almost nothing.

Questions immediately arise:
- Which production batch did it belong to?
- Which work order generated it?
- Which production line produced it?
- Which machine was used?
- Which mold cavity was involved?
- Which raw material supplier provided the material?
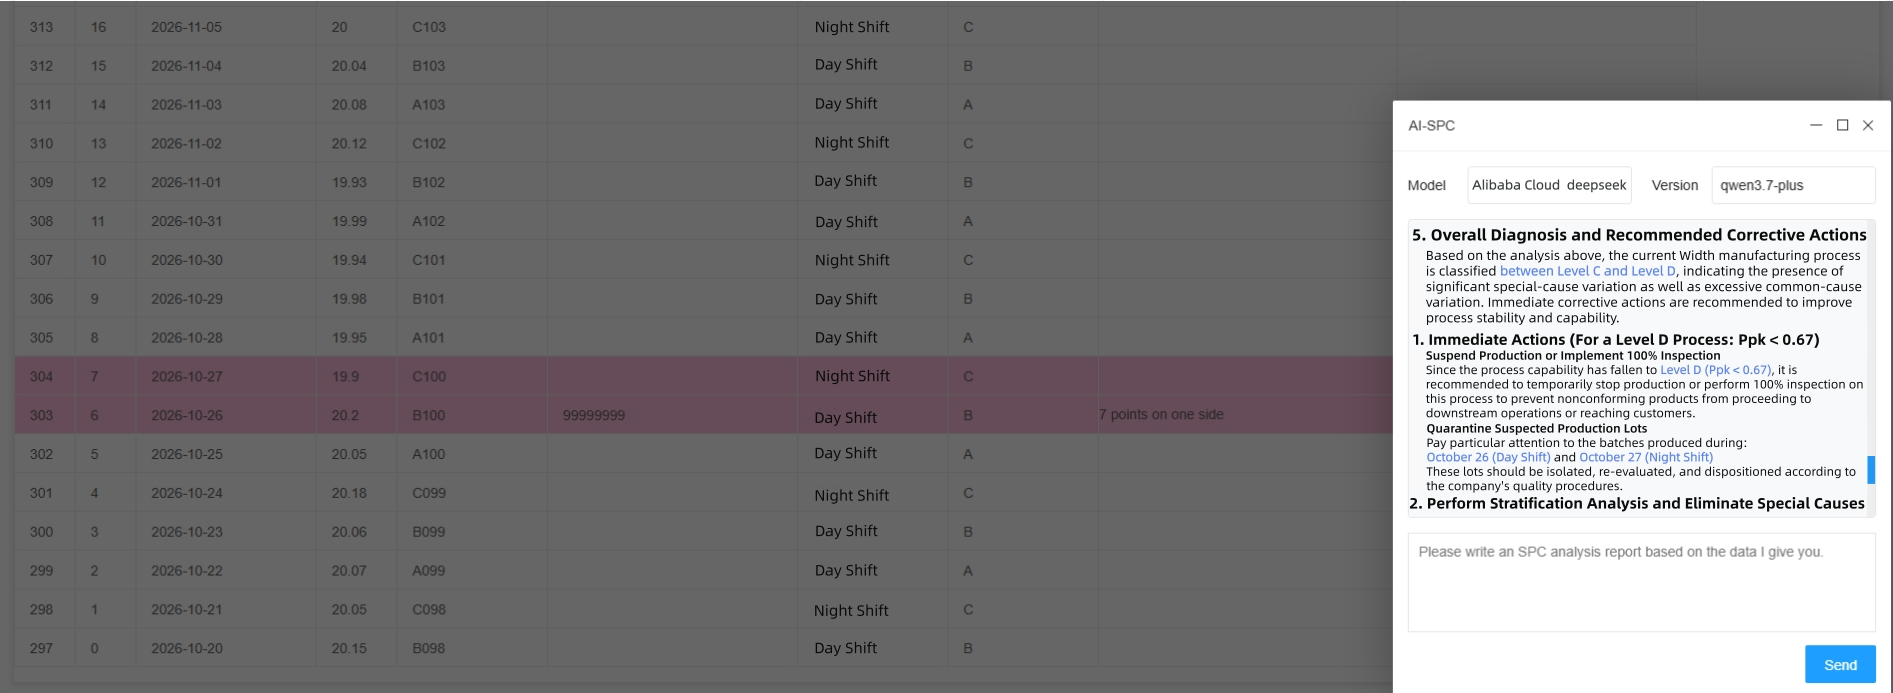
Without this information, when an SPC rule violation occurs, quality teams are forced into guesswork and trial-and-error troubleshooting.
The software may generate beautiful charts, but SPC remains disconnected from actual manufacturing operations.
It becomes a compliance tool rather than a quality improvement system.
What Real SPC Data Should Look Like
Advanced digital quality systems do not simply store measurement values.
Instead, they build a structured relationship model at the moment data is generated.
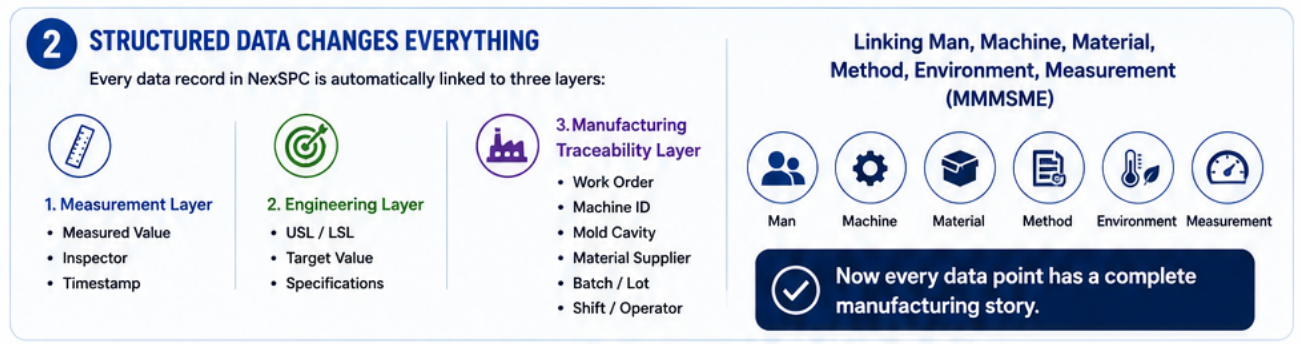
Every quality record should permanently link three layers of information:
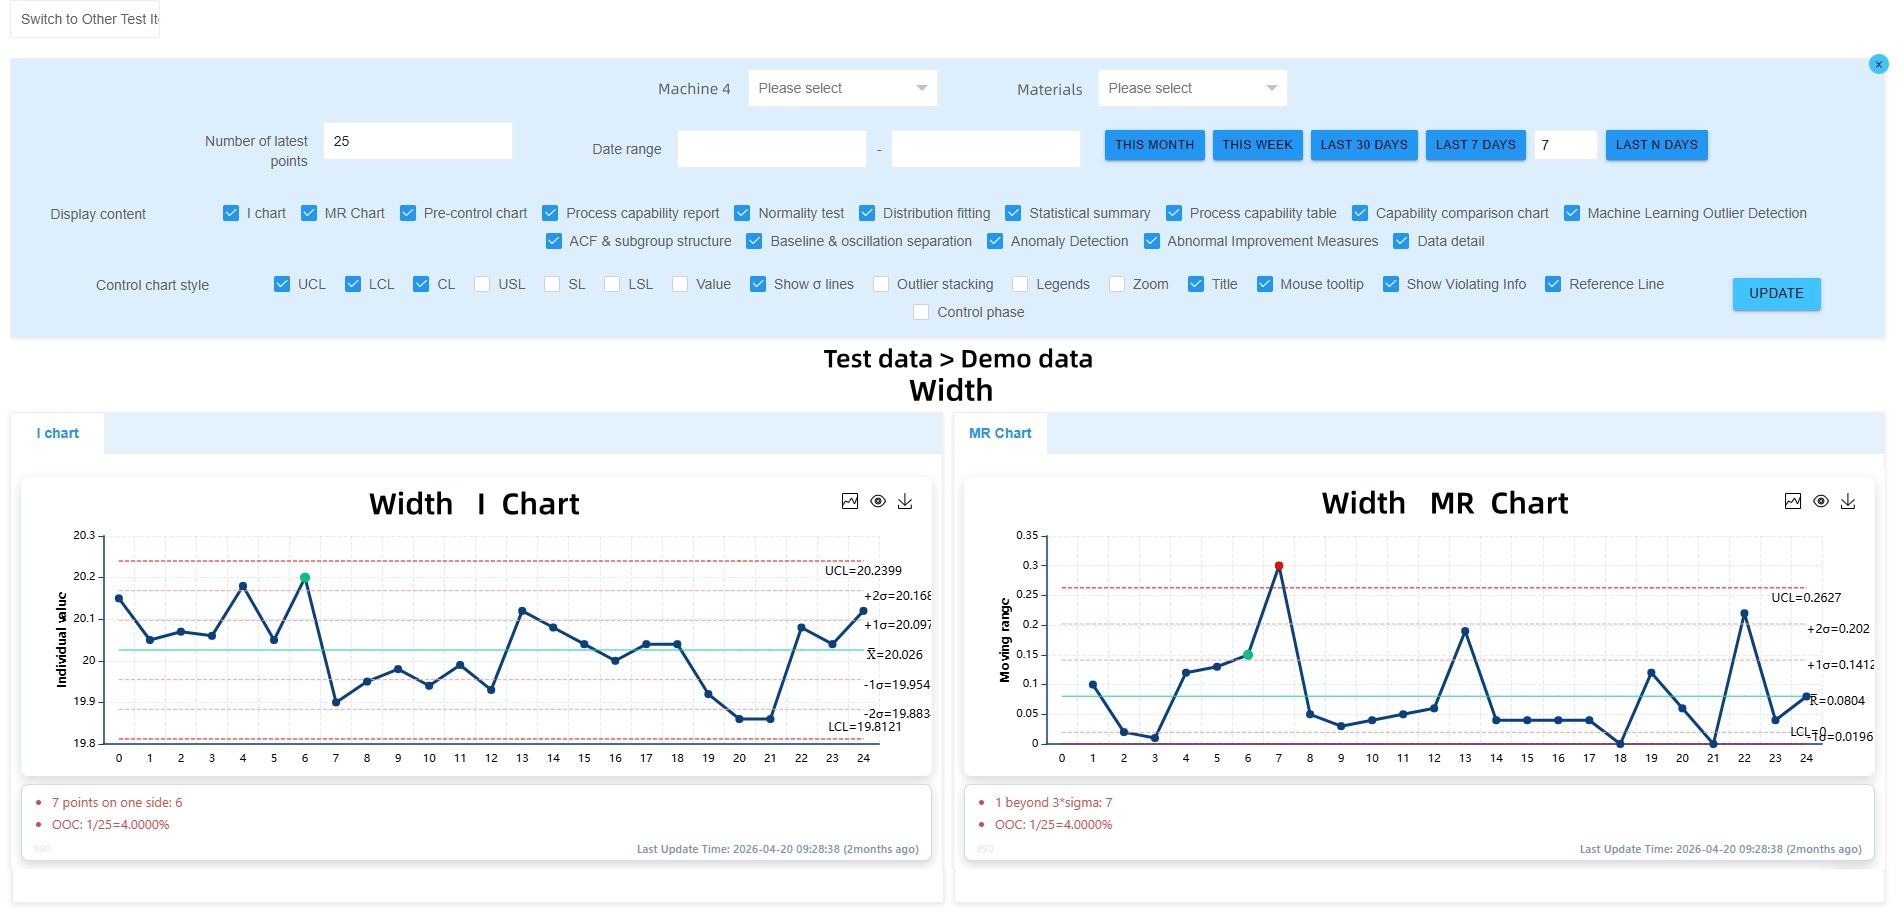
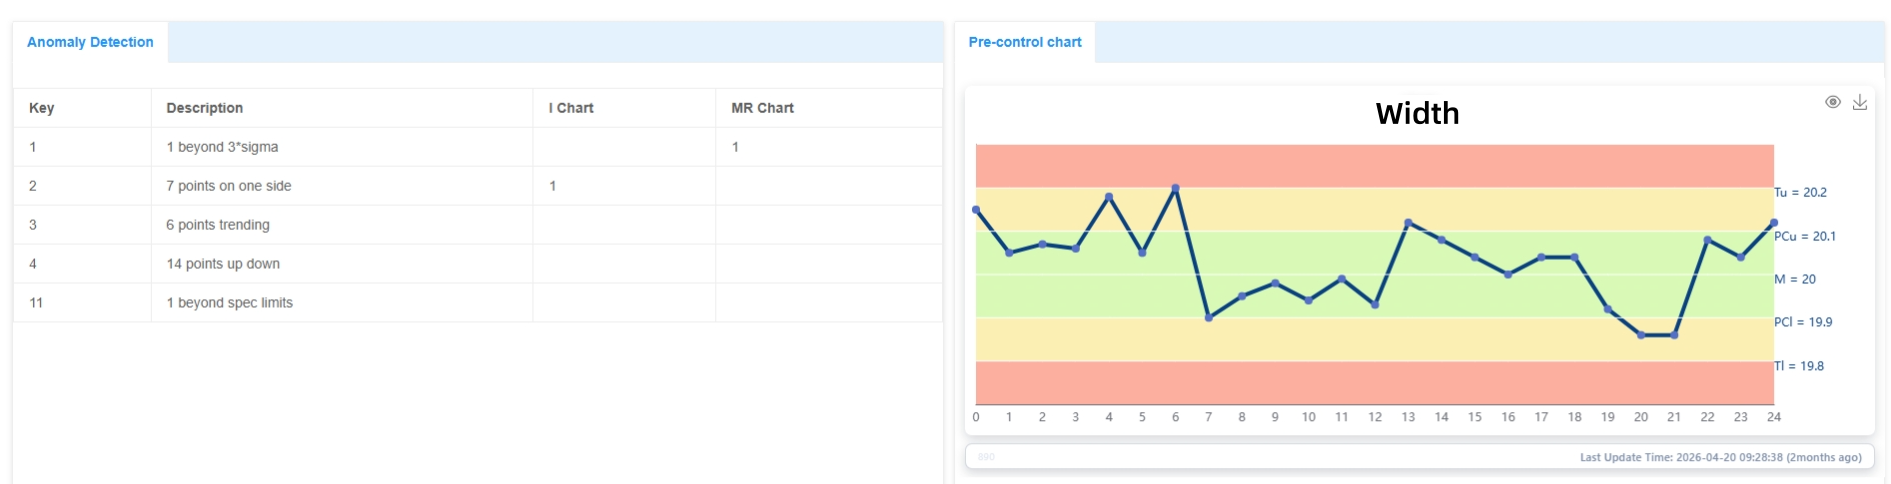
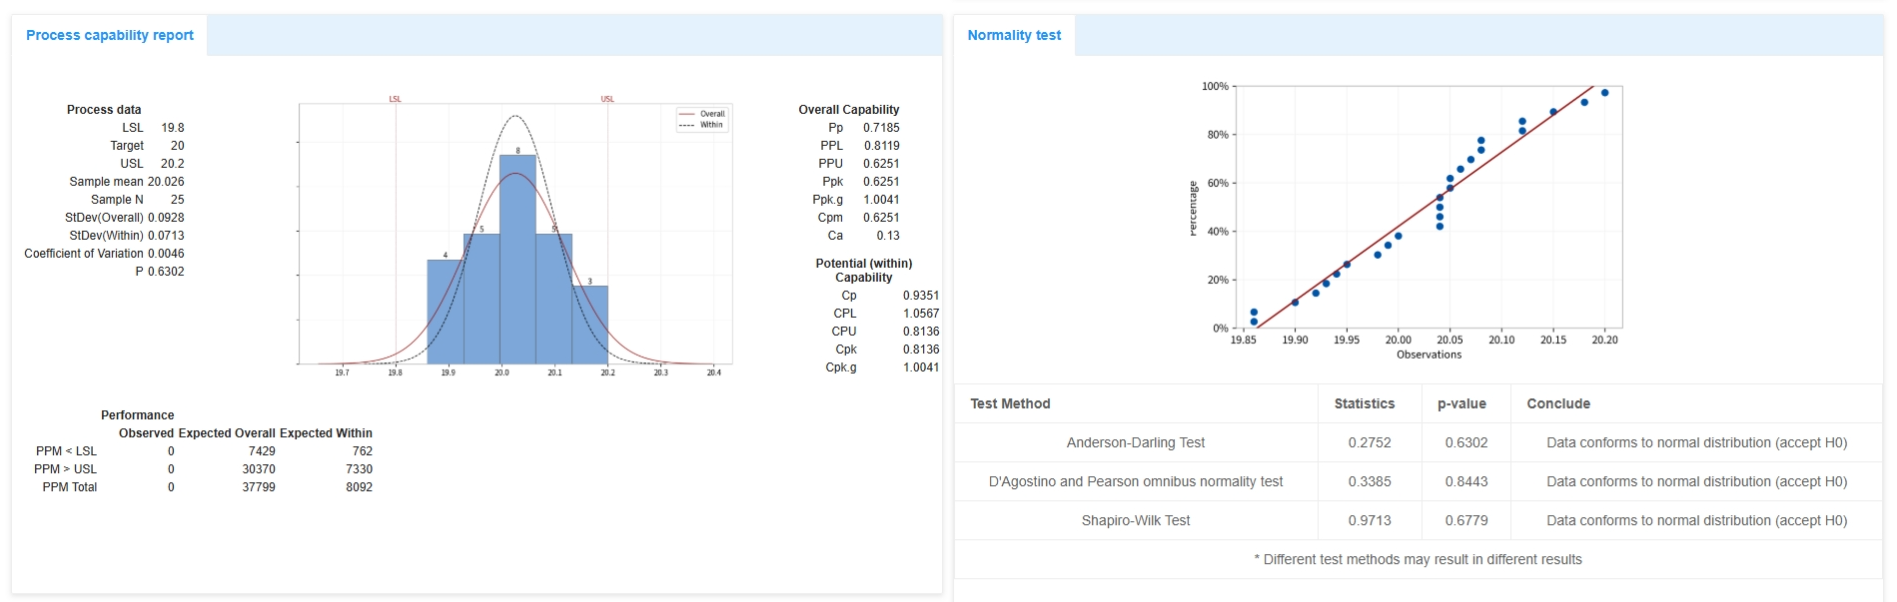
1. Measurement Layer
Captures:
- Actual measured value
- Inspector information
- Timestamp
2. Engineering Specification Layer
Automatically associates:
- Upper Specification Limit (USL)
- Lower Specification Limit (LSL)
- Target Value
3. Manufacturing Traceability Layer
Links manufacturing context such as:
- Work Order Number
- Batch Number
- Machine ID
- Mold Cavity
- Material Supplier
In other words:
Man · Machine · Material · Method · Environment · Measurement
are all connected to every measurement record.
When Data Gains Context, SPC Becomes a Business Weapon
Once manufacturing traceability is fully integrated into SPC, every measurement value gains a complete manufacturing history.
The system knows:
- Which machine produced it
- Which shift processed it
- Which operator was involved
- Which supplier provided the material
- Which upstream process contributed to the result
At this point, SPC becomes far more than a quality tool.
It becomes a management tool.
A decision-making tool.
A competitive advantage.
Advantage #1: Smarter Production Resource Allocation
Imagine two identical machines:
- Machine A
- Machine B
Both produce the same part.
Both appear to have similar output.
Both achieve acceptable final inspection results.
Under traditional management, they look equally capable.
However, structured SPC analysis reveals a different story:
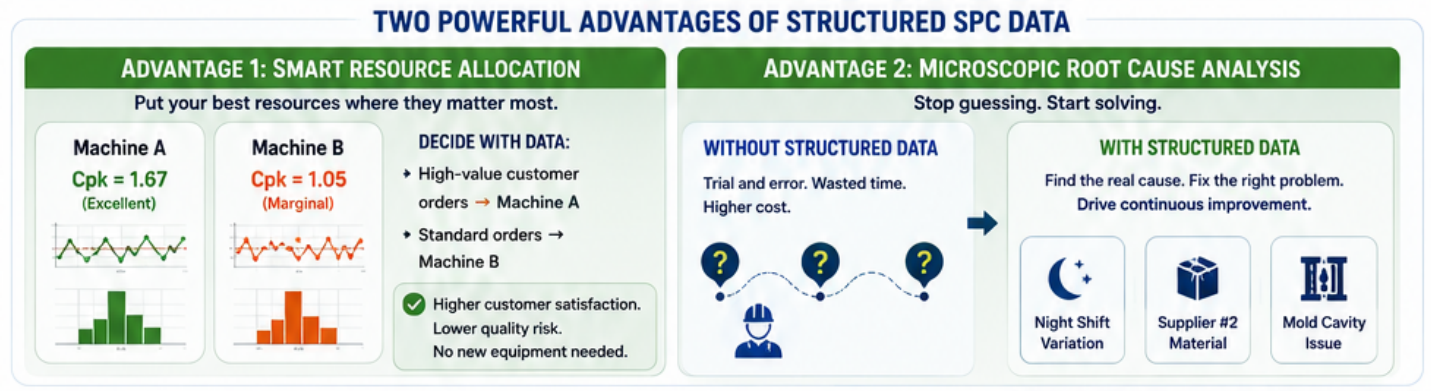
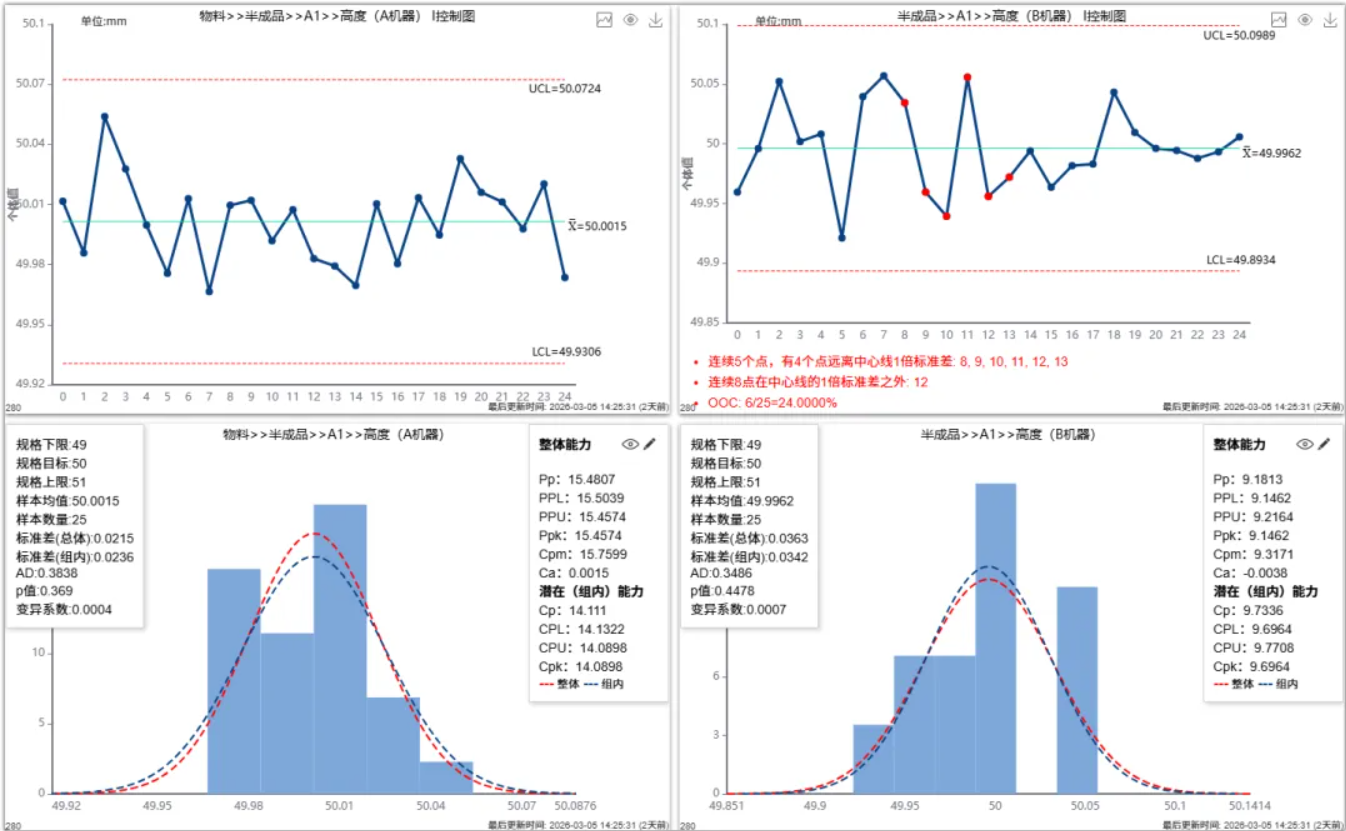
- Machine A: Cpk = 1.67
- Machine B: Cpk = 1.05
Suddenly the decision becomes obvious.
A smart production manager can immediately assign:
- High-value customer orders → Machine A
- Standard production orders → Machine B
Without purchasing any new equipment, the company can dramatically improve customer satisfaction and reduce quality risk.
This is where quality data directly supports business performance.
This is quality-driven operations management.
Advantage #2: Microscope-Level Root Cause Analysis
The next question becomes:
Why is Machine B performing worse?
Without structured data, engineers often resort to:
- Adjusting machine settings
- Replacing tools
- Running trial-and-error experiments
This consumes time and resources.
With structured SPC data, the answer becomes much clearer.
The system may reveal:
- Variation occurs primarily during night shifts.
- Process stability decreases when material from Supplier #2 is used.
- A specific mold cavity consistently produces greater variation.
Suddenly, root cause analysis becomes focused and evidence-based.
Engineers can investigate specific factors instead of searching blindly.
Continuous improvement becomes dramatically faster and more effective.
How NexSPC Makes Structured SPC Practical
Most manufacturers understand the value of traceability.
The challenge is implementation.
Manually linking:
- Work orders
- Shifts
- Mold information
- Machine IDs
- Supplier records
to every measurement value using spreadsheets is nearly impossible.

Many traditional SPC systems attempt to solve this problem, but often introduce new challenges:
- Long implementation cycles
- Complex customization projects
- Expensive licensing models
- High annual maintenance fees
As a result, companies end up creating new data silos rather than eliminating them.
How NexSPC Solves the Problem
NexSPC was designed from the ground up around structured manufacturing data.
The platform supports:
Flexible Data Collection
- Manual Entry
- Excel Import
- HTTP APIs
- TCP Communication
- MQTT
- OPC Connectivity
No matter how data enters the system, custom structured fields can be attached automatically.
The traceability chain is established from the very first record.
Deploy in One Day
NexSPC uses a pure Browser/Server architecture.
Benefits include:
- No client installation
- Browser-based access
- Factory-wide deployment
- Large-screen dashboards
- Engineering workstations
Users simply open a browser and log in.
Perpetual Licensing with Unlimited Users
Unlike many subscription-based SPC systems, NexSPC provides:
- One-time purchase
- Lifetime licensing
- Unlimited users
- Unlimited concurrent access
- Unlimited inspection characteristics
- Unlimited dashboards
This allows organizations to scale without worrying about licensing costs.
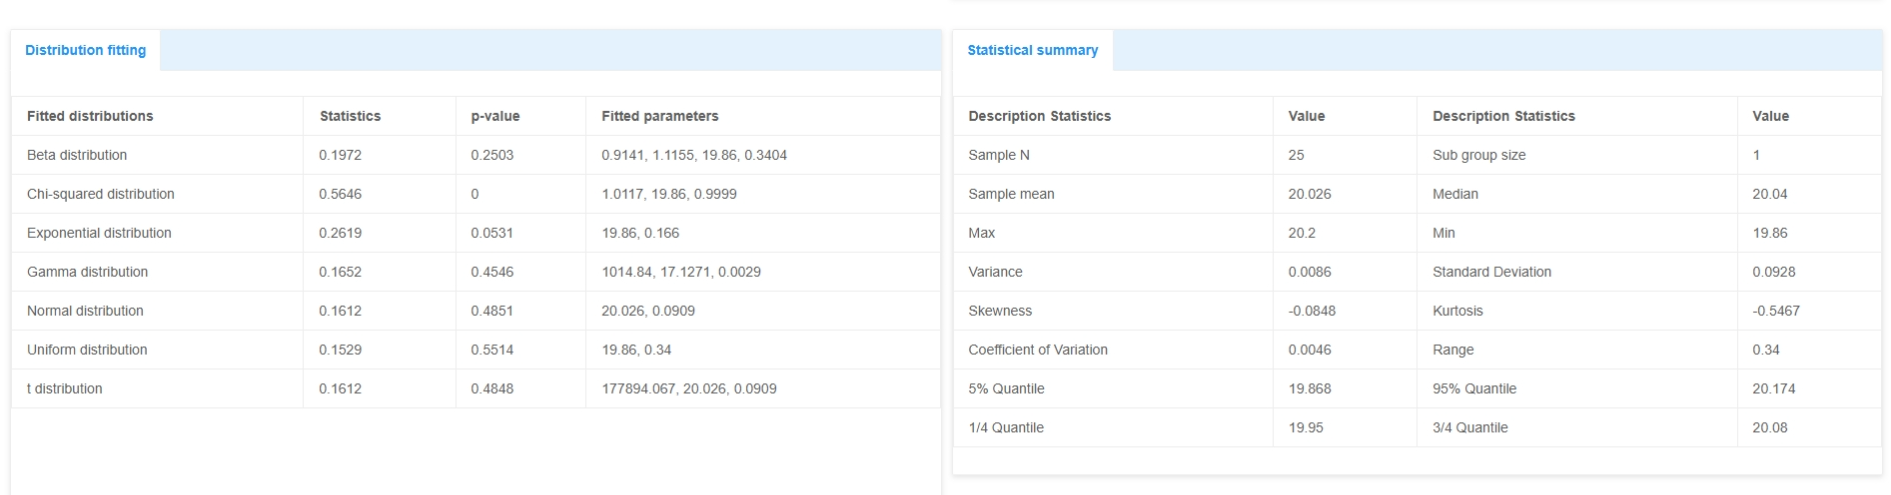
Comprehensive Statistical Analysis
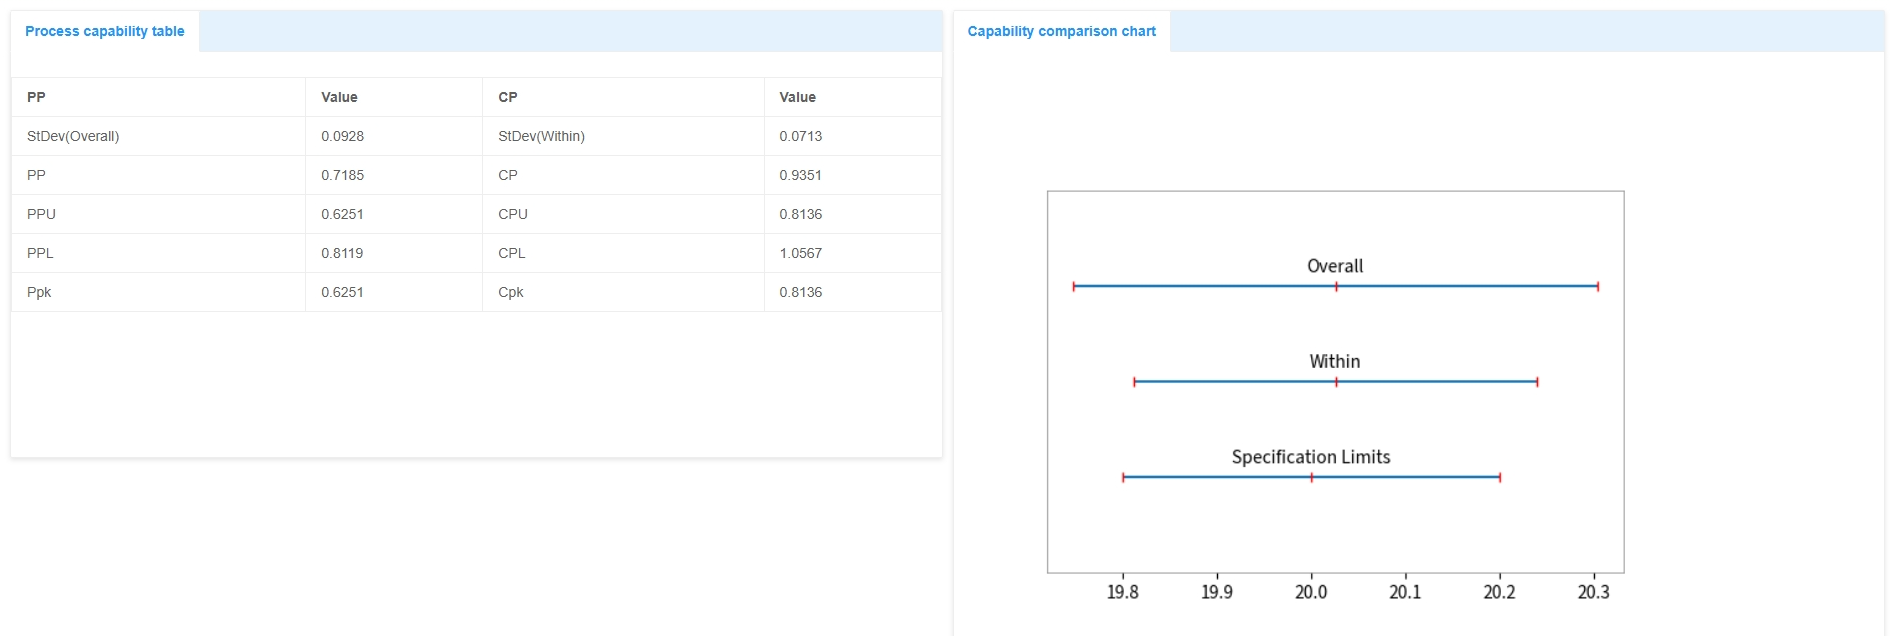
NexSPC includes a complete suite of quality tools:
- SPC Control Charts
- Cpk Analysis
- Normality Testing
- Process Capability Histograms
- Rainbow Charts
- Correlation Analysis
- Regression Analysis
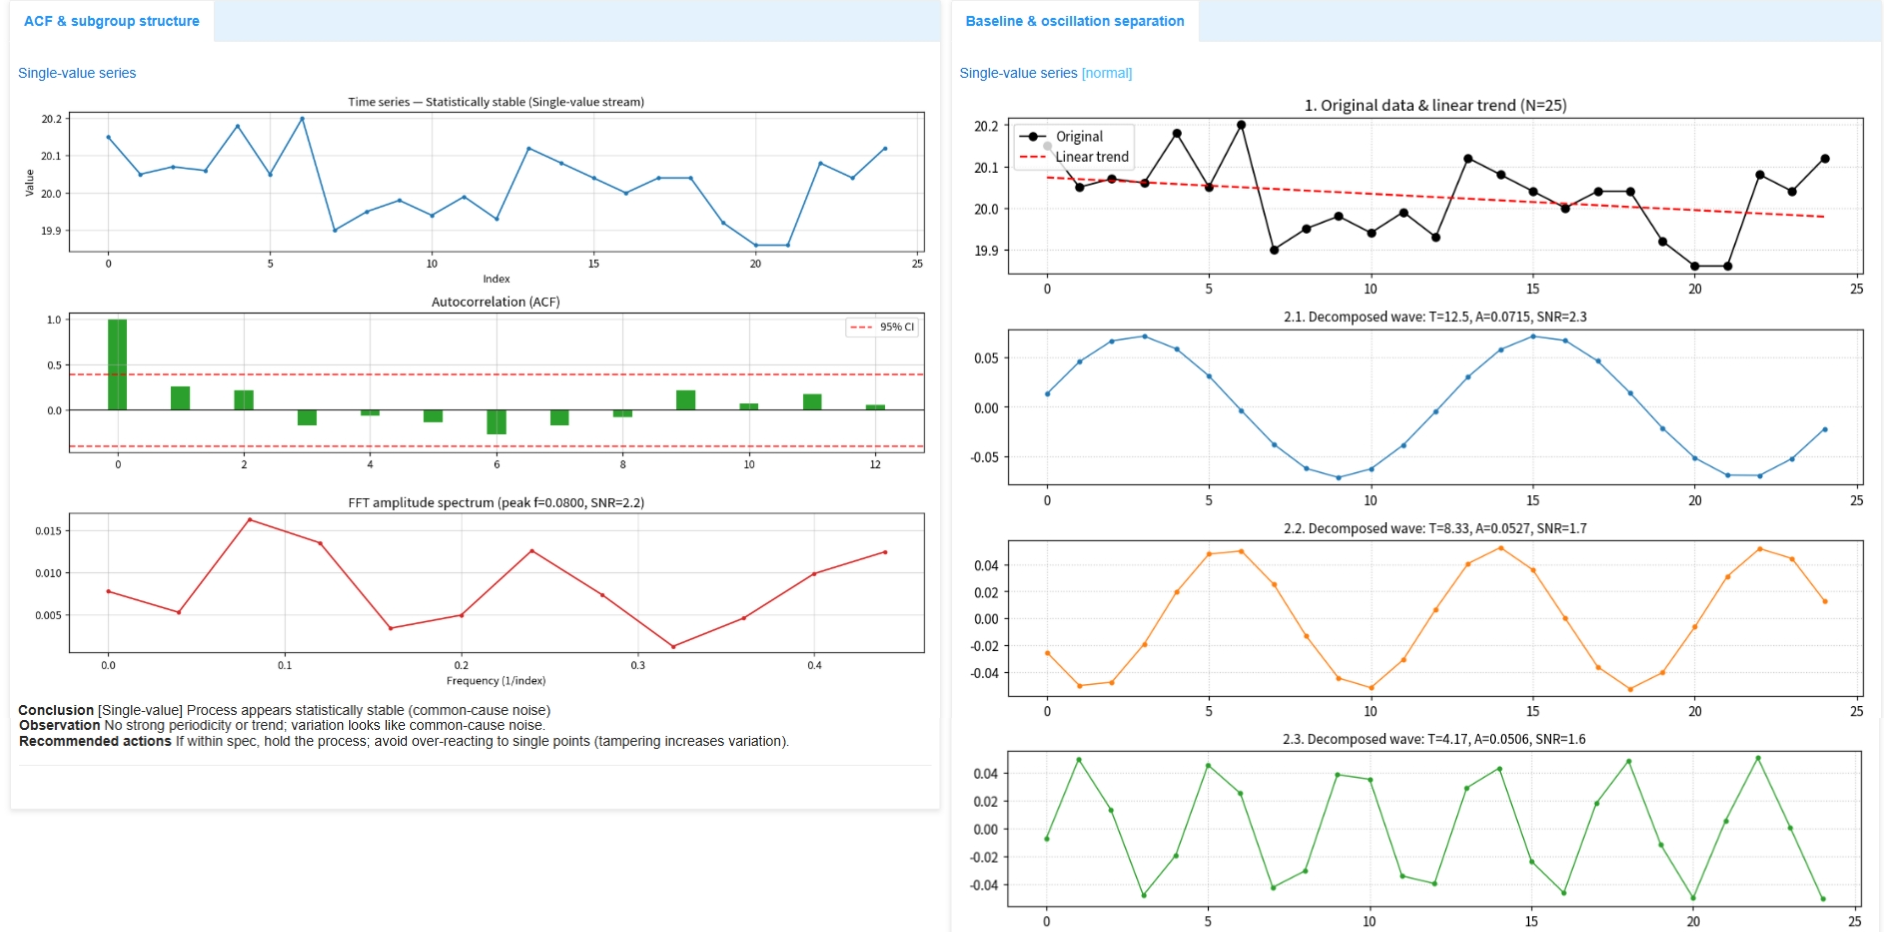
- AI-Powered Interpretation Reports
With a single click, engineers can generate comprehensive statistical reports without switching between multiple software packages.
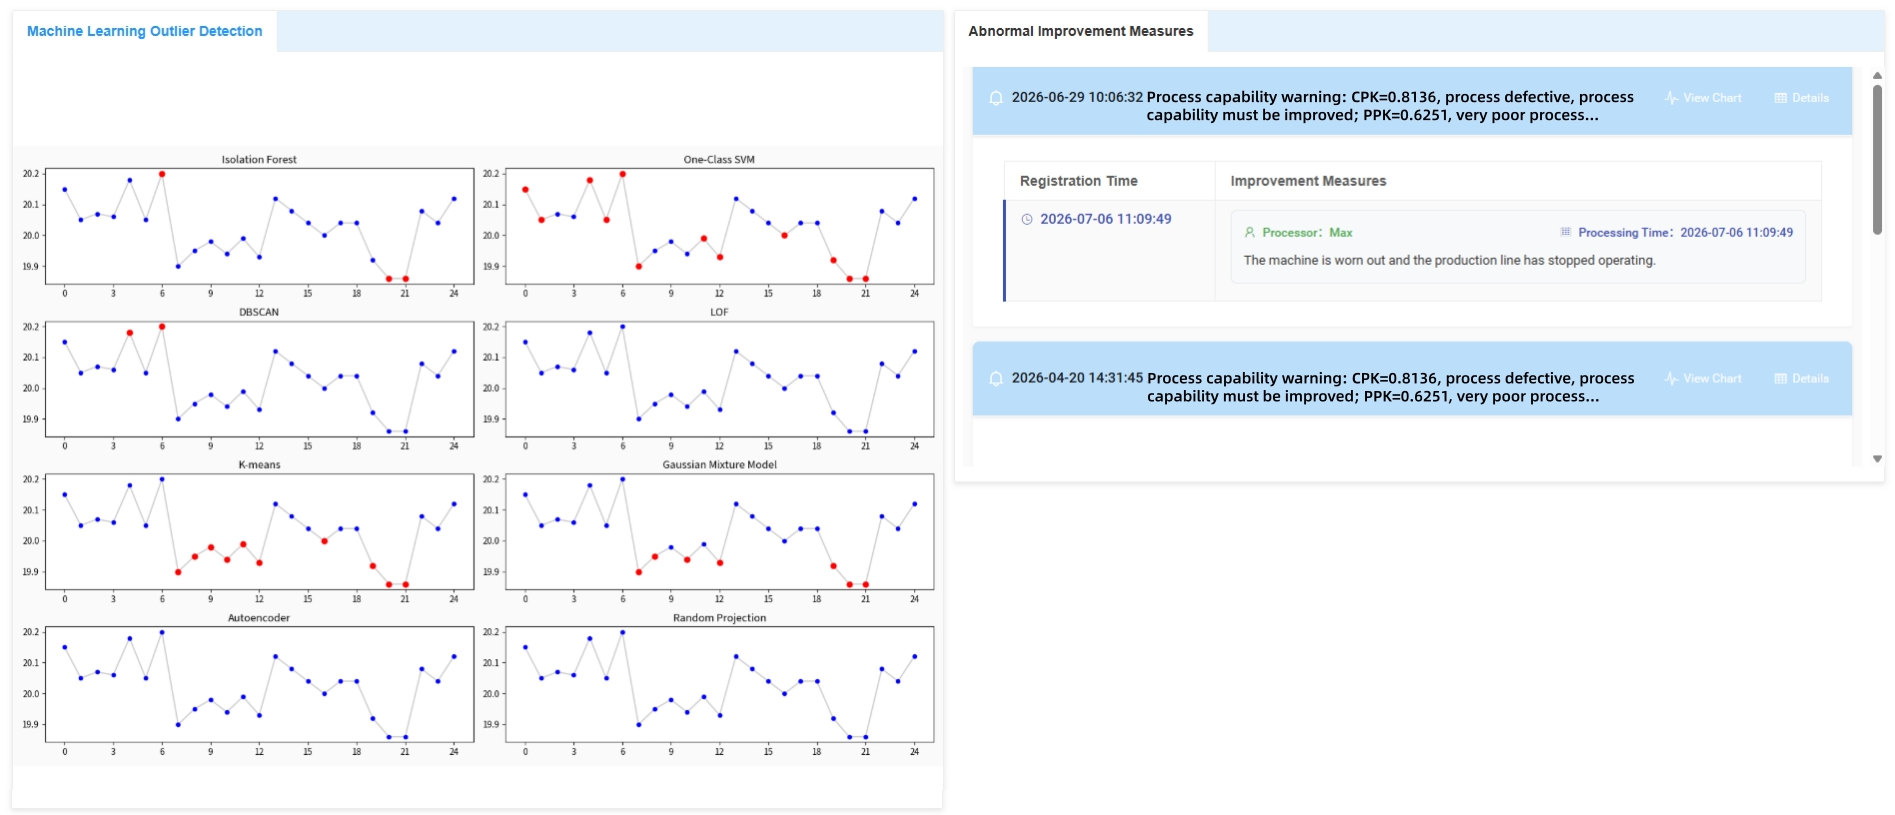
Real-Time Alerts and Global Collaboration
When the system detects:
- SPC rule violations
- Cpk abnormalities
- Ppk abnormalities
alerts can be delivered instantly through:
- DingTalk
- Lark (Feishu)
- WeCom
- Other integrated channels
NexSPC also supports multiple languages, including:
- English
- Spanish
- Vietnamese
- Thai
- Chinese
making it suitable for multinational manufacturing operations and global quality teams.
The Real Starting Point of SPC Is Not Statistics
Many people assume SPC begins with:
- Control Charts
- Cpk Calculations
- Statistical Rules
In reality, successful SPC starts much earlier.
It starts with: A strong and structured data foundation.
Without traceability, SPC becomes a charting exercise.
With traceability, SPC becomes a decision-making system.
The ultimate goal of SPC is not simply to calculate statistics.
It is to help manufacturers:
- Understand process variation
- Identify root causes
- Improve process capability
- Pass customer audits with confidence
- Drive continuous improvement
And most importantly: Turn quality data into business value.