


In many companies, people assume that SPC control charts should always include:
- Upper Control Limit (UCL)
- Center Line (CL)
- Lower Control Limit (LCL)
However, in real industrial applications, you will often find that:
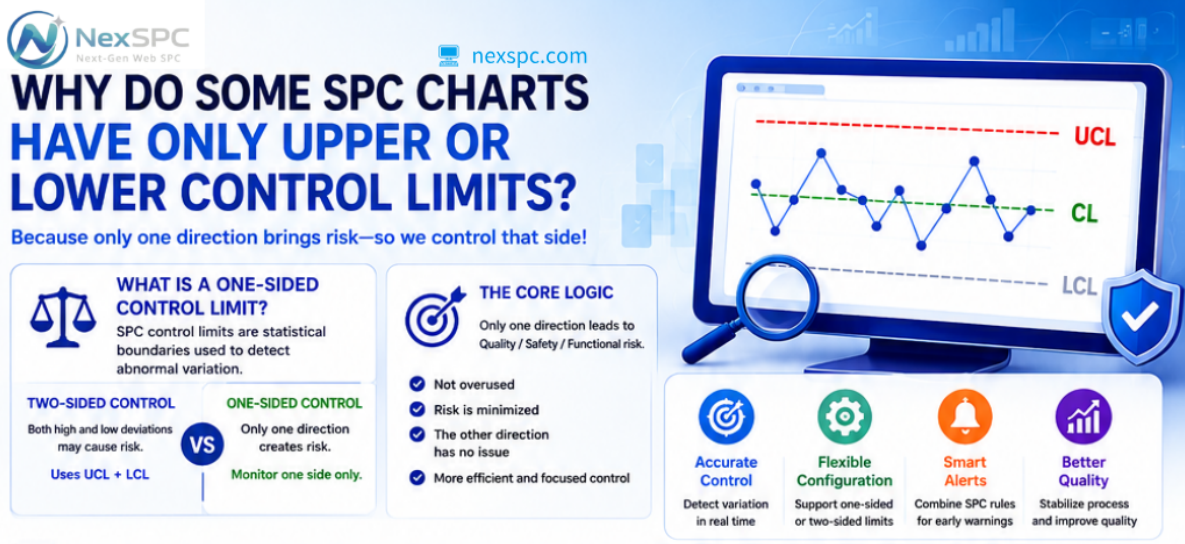
√Some control charts only have an Upper Control Limit (UCL)
√ Some control charts only have a Lower Control Limit (LCL)
This is not a system error.
Instead: The process characteristic itself determines whether only one-sided control is needed.
1. What Are One-Sided Control Limits?
In SPC, control limits are essentially:
Statistical boundaries used to identify abnormal process variation.
Standards such as:
- AIAG
- Western Electric
- Nelson Rules
all support one-sided control logic.
Under normal circumstances:
- Excessively high values
- Excessively low values
may both introduce risks.
Therefore, most processes use:
Two-Sided Control Limits (UCL + LCL)
However, some processes only become risky in one direction.
As a result: SPC only needs to monitor one side.
2. When Is Only an Upper Control Limit (UCL) Needed?
Core logic:
“Too high” creates problems, while “too low” usually does not.
(1)Chemical Concentration / Toxicity Control (Most Typical)
Examples include:
- Heavy metal content
- Pesticide residue
- Chemical concentration
- Food additives
- VOC emissions
Why only an upper limit?
Because excessive levels may lead to:
- Toxicity
- Safety risks
- Regulatory non-compliance
While lower values are usually not dangerous.
Therefore: SPC only monitors the Upper Control Limit (UCL).
(2)Defect Rate / Defective Quantity Monitoring
Typical control charts:
- P Chart
- NP Chart
- C Chart
- U Chart
Characteristics:
√Higher defect rates are dangerous.
√Lower defect rates are generally better.
It is impossible for: “An unusually high yield rate” to become a problem.
Therefore: Only the Upper Control Limit is needed.
(3)Contamination / Cleanliness Monitoring
Examples include:
- Cleanroom particle counts
- Emission pollution monitoring
- Dust concentration
Characteristics:
√Exceeding the limit is dangerous.
√Lower values are safer.
(4) Delay / Response Time Monitoring
Examples:
- API response time
- Network latency
- Equipment response time
Characteristics:
√Slow response is problematic.
√Faster response is usually acceptable.
Therefore: Only the UCL needs to be monitored.
3. When Is Only a Lower Control Limit (LCL) Needed?
Some processes are exactly the opposite: “Too low” becomes the real risk.
(1)Material Strength
Examples:
- Tensile strength
- Welding strength
- Pressure resistance
Characteristics:
√Insufficient strength may cause failure.
√Higher values are usually acceptable.
Therefore: Only the Lower Control Limit (LCL) is required.
(2)Voltage / Air Pressure / Flow Rate
Examples:
- Vacuum pressure
- Air supply pressure
- Hydraulic systems
Characteristics:
√Insufficient pressure may cause equipment malfunction.
√Slightly higher pressure is often still acceptable.
(3)Critical Performance Lower Limits
Examples:
- Battery capacity
- Motor torque
- Signal strength
Characteristics:
√ Falling below the minimum requirement leads to functional failure.
4. Why Do Many Companies Incorrectly Assume “Two-Sided Control” Is Always Required?
Because many SPC software systems automatically generate:
- UCL
- CL
- LCL
by default.
However: Statistical methods must match actual process risks.
Not every process needs to monitor:
√Both high-side and low-side variation simultaneously.
5. Are One-Sided Control Limits Completely Valid in SPC?
Absolutely.
In fact, many classic SPC control charts are naturally based on:
One-sided control logic.
For example:
- P Charts
- NP Charts
- C Charts
- U Charts
The reason is simple: Defect quantities cannot be less than zero.
6. NexSPC: Flexible Support for Both One-Sided and Two-Sided Control Limits
NexSPC fully supports flexible SPC control limit configuration.
(1)Two-Sided Control Limits
Suitable for scenarios such as:
- Dimensions
- Weight
- Temperature
- Thickness
where both:
- Excessively high values
- Excessively low values
must be monitored.
(2)One-Sided Control Limits
Supports:
- UCL only
- LCL only
Especially suitable for industries such as:
- Pharmaceuticals
- Food manufacturing
- Chemical processing
- Medical devices
- Semiconductor manufacturing
- Environmental monitoring
(3)Custom Control Limits
Supports independent configuration of:
- UCL
- CL
- LCL
(4)Automatic Calculation + Custom Dual Modes
Companies can: Flexibly switch based on process characteristics.
7. What Truly Matters Is Not “Whether Both Limits Exist,” but “The Direction of Risk”
The core objective of SPC is not: Making charts look complete.
Instead, it is: Accurately identifying process risks.
Therefore: One-sided control limits are not “missing a line.”
They are: A statistical control method that better matches real industrial logic.
Many companies still use SPC in the following way:
“Whatever the software generates by default is what we use.”
But truly mature SPC applications should:
Define control strategies based on actual process characteristics.
NexSPC helps enterprises achieve this through:
- One-sided / two-sided control limit support
- Automatic calculation
- Custom configuration
- Real-time alerts
Helping manufacturers truly move: From “data recording” to “process control.”