


NEXSPC Goes Viral with 3-Minute Reporting and Automatic Rule Violation Detection**
“Your customer needs a CPK report tomorrow, and you’re working overtime again tonight?”
“No — I can finish it in just 3 minutes.”
In manufacturing, CPK (Process Capability Index) is the ultimate KPI report card for quality engineers.
But calculating CPK in Excel often becomes an endless cycle of:
copying data → pasting → applying formulas → drawing charts → fixing errors → redrawing charts.
That changed after using the NEXSPCanalysis tool.
With one click, you can generate:
- Xbar-R control charts
- Normal probability plots
- Process capability reports
- Automatic SPC rule violation detection with highlighted abnormal points
This article will help you completely say goodbye to Excel-style SPC frustration.
Why Is Your CPK Calculation Always Inaccurate?
First, ask yourself these three questions:
- Do you clearly distinguish between within-subgroup standard deviation and overall standard deviation every time?
- Are your control chart UCL/LCL values calculated correctly, or estimated manually?
- How do you verify normal distribution? Are you still spending 30 minutes performing AD tests in Excel?
If any single step is wrong, your CPK result becomes misleading.
Even worse, when customers or auditors request Xbar and R control charts, all you can provide is a simple line chart without proper control limits.
NEXSPC: The CPK Calculation Tool Every Quality Engineer Wants
Open NEXSPC, and you’ll see an interface as simple as a quality record sheet — yet powerful enough to surprise you.
Let’s see how it handles the entire CPK workflow.
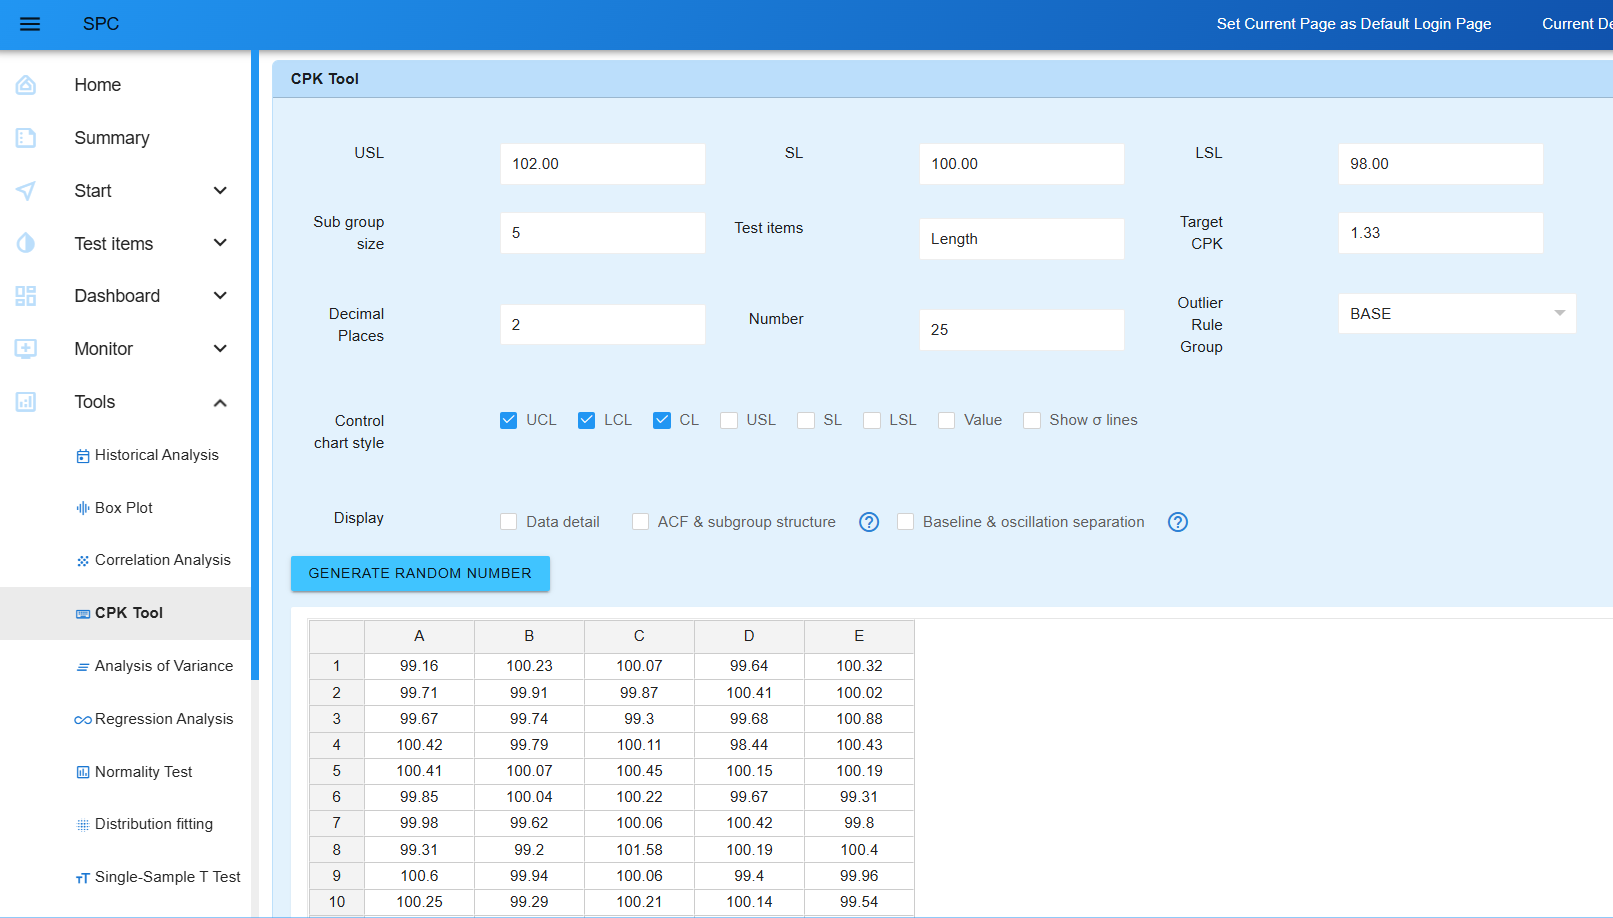
One-Click Calculation with Automatic Output
Click “CPK Calculation”, and the system instantly generates:
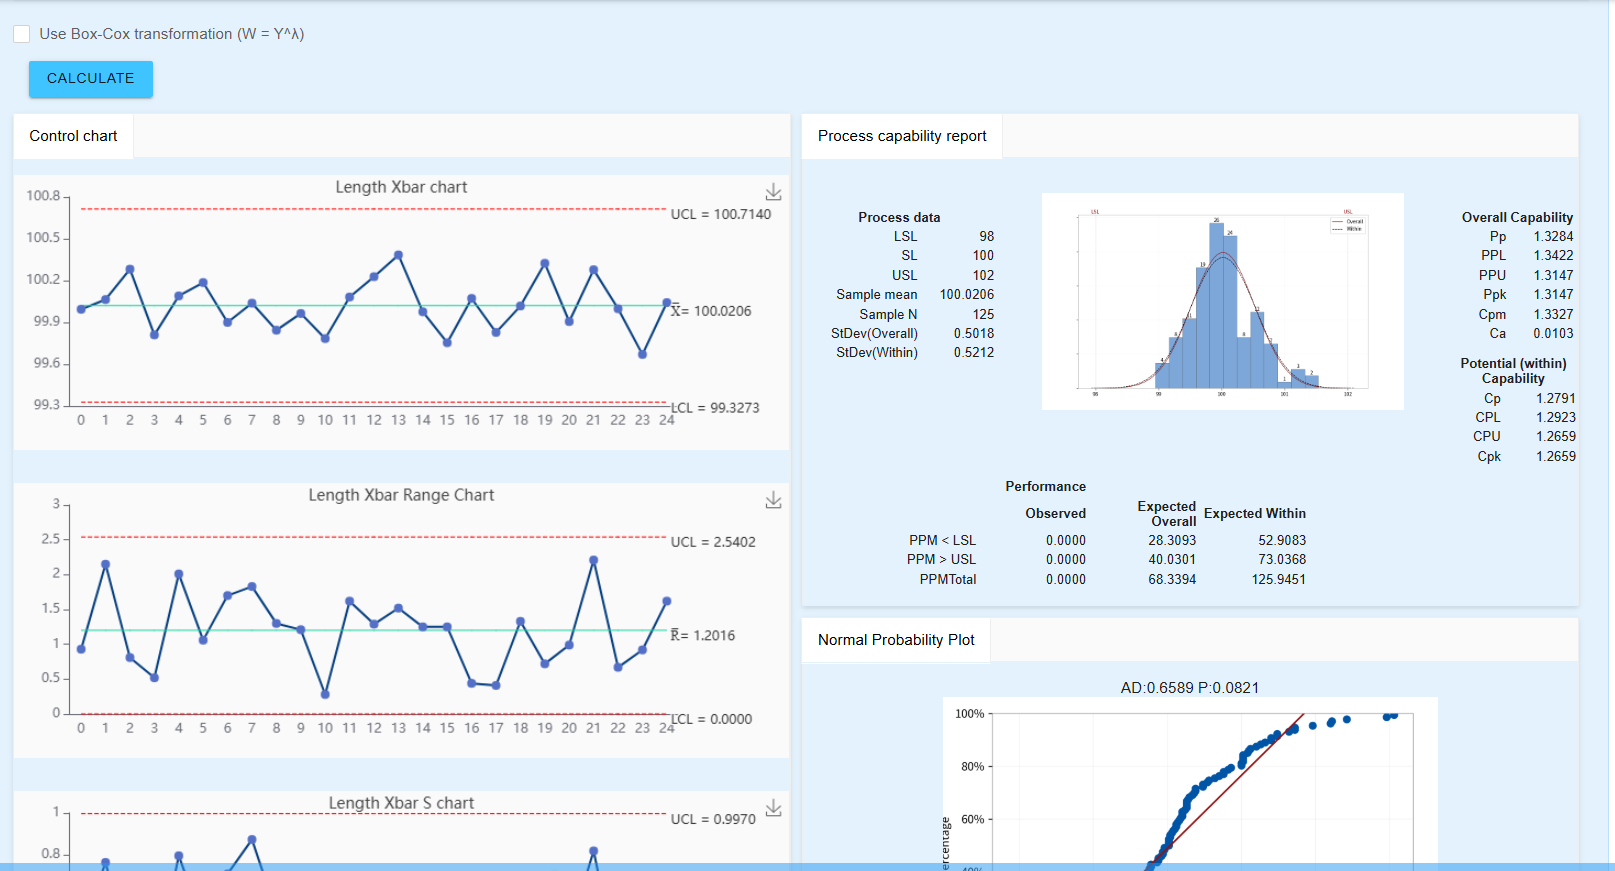
Process Capability Reports
- Cp, Cpk, CPL, CPU
- Sample mean
- Overall standard deviation
- Within-subgroup standard deviation
Complete Control Chart Suite
- Xbar Control Chart (monitor mean shift)
- R Control Chart (monitor range variation)
- Moving Range Control Chart (for individual values)
Statistical Analysis
- Normal probability plot + AD test P-value
- Automatic SPC rule violation alarms
For example:
“1 point beyond 3 sigma from the center line: Point 3”
The system directly identifies:
- Which SPC rules were violated
- Which data points triggered the violations
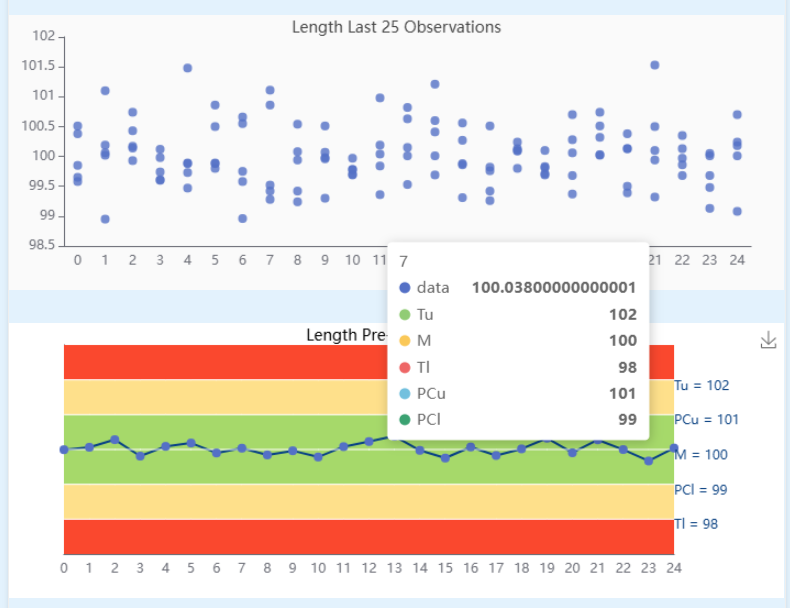
Enhanced Visualization
Rainbow Charts
Different batches or time periods are displayed in different colors, making trends immediately visible.
Latest 25 Observations
Focus on recent process performance at a glance.
Specification Limits Overlay
USL/LSL can be displayed directly on control charts for intuitive comparison.
Real Case: Automotive Parts Dimension CPK Analysis
A supplier needed to submit a CPK report for a Length dimension inspection.
The dataset contained 125 measurements with a subgroup size of 5.
Using NEXSPC:
- Paste the data
- Enter USL = 102, SL = 100, LSL = 98
- Click “CPK Calculation”
Three seconds later, the system returns:
- Cp = 1.32, Cpk = 1.31 (process capability is sufficient)
- Xbar Chart: UCL = 100.65, LCL = 99.35
- R Chart: UCL = 2.37, R̄ = 1.12
- Normal Probability Plot: AD = 0.337, P = 0.502 (normal distribution confirmed)
- Rule Violation Result: No abnormal points, process under control
The entire process takes less than 3 minutes, with one-click report export.
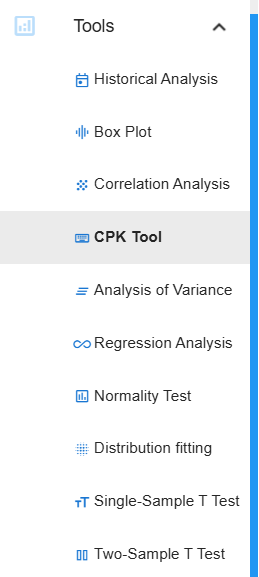
More Than CPK: One Tool for Complete SPC Analysis
Under the “Analysis Tools” menu in NEXSPC, you’ll also find these powerful features:
| Function | Purpose |
|---|---|
| Box Plot | Compare data distributions and identify outliers |
| Correlation Analysis | Determine linear relationships between variables |
| ANOVA | Analyze significant differences between batches, machines, or operators |
| Regression Analysis | Build models between process parameters and quality characteristics |
| Normality Test | Verify SPC assumptions |
| Distribution Fitting | Automatically fit Weibull, Lognormal, and other distributions |
| One-Sample T-Test | Determine whether the sample mean deviates from the target |
Most importantly, all analyses are based on the current dataset — just click and analyze without switching software.
Why Is NEXSPC Suddenly So Popular?
- Deployable within 1 day
- Affordable pricing
- Unlimited users, unlimited online users, unlimited data points, unlimited dashboards, one account per user
- Browser-based access for all users
- Server-based lifetime licensing with no annual subscription fees
- Supports SPC control charts: I-MR, Xbar-S, Xbar-R, MR-R/S, NP, C, P, U
- Fully supports the eight standard SPC rule violation rules (plus custom rules)
- Multiple data collection methods: online manual entry, Excel import, HTTP synchronization, TCP collection, MQTT collection, OPC data acquisition, DB-to-DB synchronization, shared file collection
- One-click SPC analysis reports including control charts, normality tests, rainbow charts, box plots, distribution fitting, process capability histograms, machine-learning-based rule violation charts, capability comparison charts, data summaries, AI interpretation, autocorrelation diagnostics, and baseline/separation analysis
- Create unlimited SPC monitoring dashboards including dynamic dashboards, comprehensive dashboards, and statistical dashboards with SPC charts, rainbow charts, histograms, and box plots for any inspection item — ideal for workshop display screens
- Backend monitoring for SPC rule violations, CPK, and PPK anomalies
- Notification channels: Email, WeCom, DingTalk, Feishu, MQTT, APIs
- Real-time automatic control chart updates
- 11 language versions and 20 UI themes
- Multiple analysis tools: CPK analysis, regression analysis, correlation analysis, normality tests, one-sample T-tests, two-sample T-tests, distribution fitting, and more
- Open SPC rule detection APIs and integration interfaces
- Integrated MSA (Measurement System Analysis)
- SPC collaboration for centralized supplier SPC management
- Private on-premise deployment for secure and controllable enterprise data
- Browser-based architecture with no client installation required