


Sentence 1
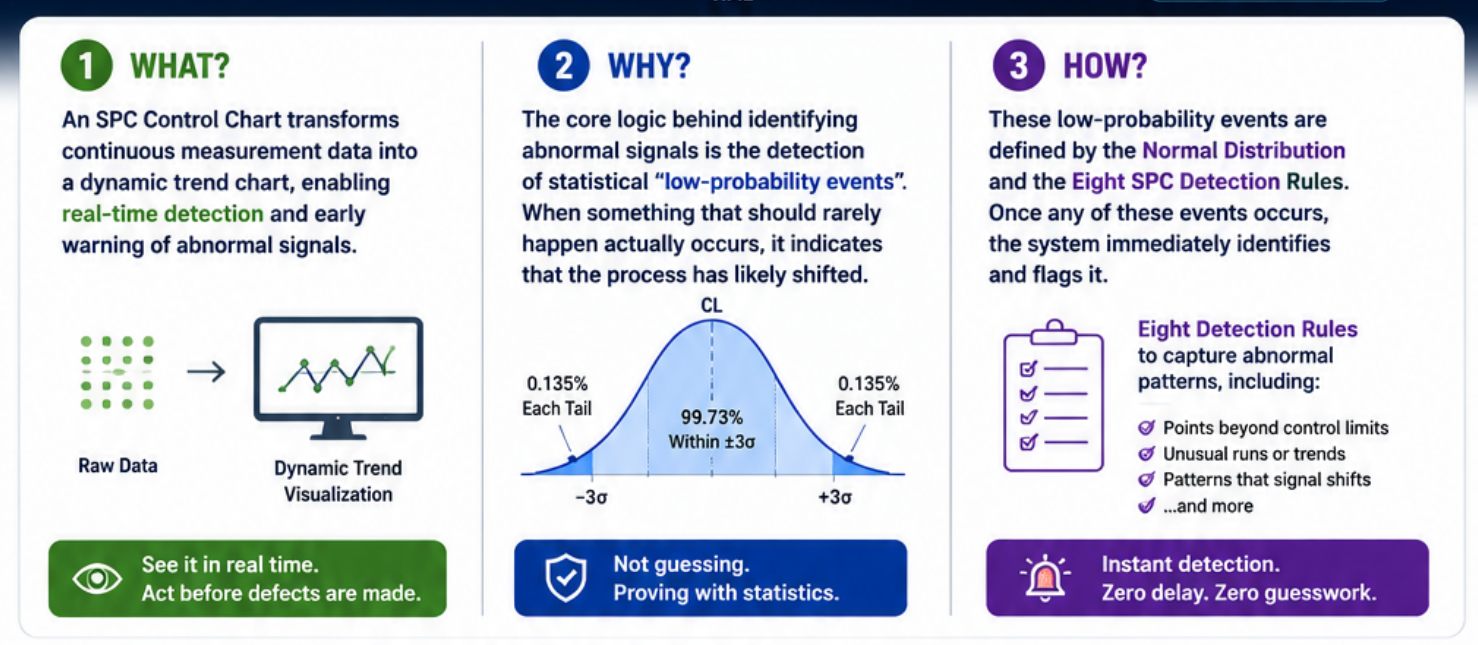
An SPC Control Chart transforms continuous measurement data into a dynamic trend chart, enabling real-time detection and early warning of abnormal signals.
Sentence 2
The core logic behind identifying abnormal signals is the detection of statistical “low-probability events” — when something that should rarely happen actually occurs, it indicates that the process has likely shifted.
Sentence 3
These low-probability events are defined by the Normal Distribution and the Eight SPC Detection Rules. Once any of these events occurs, the system immediately identifies and flags it.
If these three statements seem abstract, don't worry.
This article will explain each one step by step. By the end, you'll understand not only what an SPC Control Chart is, but also why it remains one of the most powerful quality control tools in modern manufacturing.
How Can Manufacturers Tell Whether a Process Is Healthy or Quietly Drifting Out of Control?
In modern manufacturing environments, production lines often generate hundreds of thousands—or even millions—of products.
The challenge is:
How can manufacturers accurately determine whether a process is operating normally or gradually drifting toward a quality problem?
Some people rely on experience.
Others rely on intuition.
But modern smart manufacturing relies on something far more reliable:
SPC (Statistical Process Control) Control Charts.
Many people assume SPC is complicated because it involves statistics.
In reality, the fundamental concept can be understood through the three sentences above.
Let's break them down one by one.
Layer 1: What Does an SPC Control Chart Actually Do?
SPC Control Charts Transform Data into Visual Intelligence
Every manufacturing process contains variation.
No two products are ever perfectly identical.
Minor changes in:
- Raw materials
- Machine vibration
- Environmental temperature
- Humidity
- Operator interaction
can all cause measurement values to fluctuate.
When quality data exists only in spreadsheets or inspection reports, it is difficult to identify meaningful patterns.
Quality engineers often find themselves:
Seeing individual data points but missing the overall process behavior.
SPC Control Charts solve this problem by adding:
- Time sequence
- Visualization
- Statistical context
to production data.
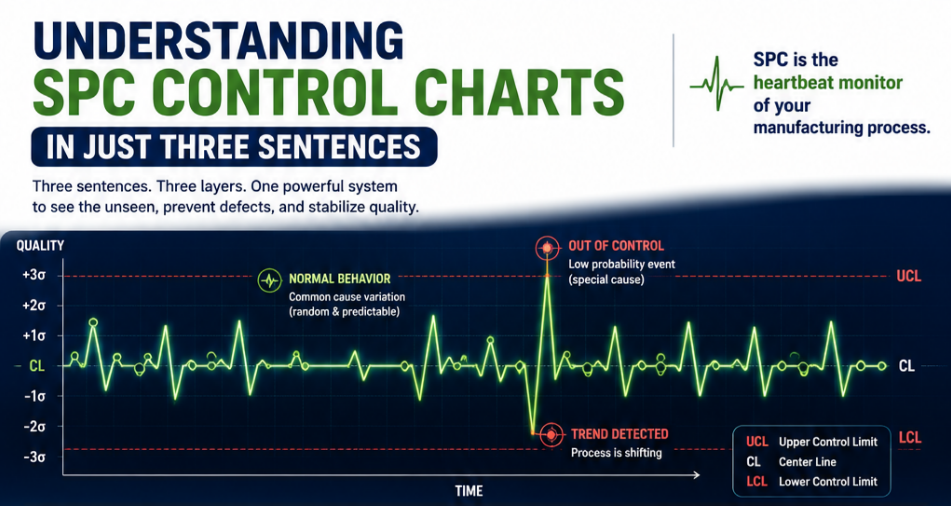
Continuous measurement results are plotted as a dynamic trend line, creating what is essentially a “heartbeat monitor” for the manufacturing process.
More importantly, the chart includes three statistically calculated reference lines:
- CL (Center Line)
- UCL (Upper Control Limit)
- LCL (Lower Control Limit)
Instead of discovering problems after defective products have already been produced, manufacturers can monitor process behavior in real time and receive immediate warnings when unusual patterns emerge.
This is the first layer of SPC.
Layer 2: Why Can SPC Detect Abnormalities?
The Principle of Low-Probability Events
Understanding how SPC identifies abnormal conditions requires understanding a fundamental statistical concept:
Low-Probability Events.
In statistics, events with extremely low probability are generally not expected to occur during normal operation.
Manufacturing variation can usually be divided into two categories:
Common Cause Variation
Normal fluctuations that naturally exist within a stable process, such as:
- Minor environmental changes
- Small machine vibrations
- Routine material variation
These variations are expected and generally do not require intervention.
Special Cause Variation
Variations caused by specific problems, such as:
- Tool wear
- Incorrect machine settings
- Material mix-ups
- Equipment malfunctions
- Measurement errors
These variations indicate that the process is no longer behaving normally.
If a process is truly stable, measurement points should fluctuate randomly within predictable limits.
However, when a highly unusual event suddenly occurs—something that statistics says should almost never happen—it becomes strong evidence that the process has changed.
In other words:
SPC does not "guess" that a problem exists.
SPC uses probability theory to prove that a problem likely exists.
This is the mathematical foundation of abnormality detection.
Layer 3: How Does SPC Define a Low-Probability Event?
The Normal Distribution and the Eight SPC Detection Rules
Understanding the theory is one thing.
Applying it on the shop floor is another.
Manufacturers cannot expect quality engineers to calculate probabilities manually every time a new data point appears.
That is why SPC relies on a standardized set of detection rules that can be automated within software systems.
These rules are based on the Normal Distribution, often called the Bell Curve.
In most manufacturing processes, measurement data tends to follow a normal distribution pattern.
According to the famous 3-Sigma Principle:
This means that:
- Approximately 99.73% of all observations fall within ±3 standard deviations.
- Only 0.27% of observations fall outside this range.
Therefore, a point beyond the control limits represents an extremely unlikely event.
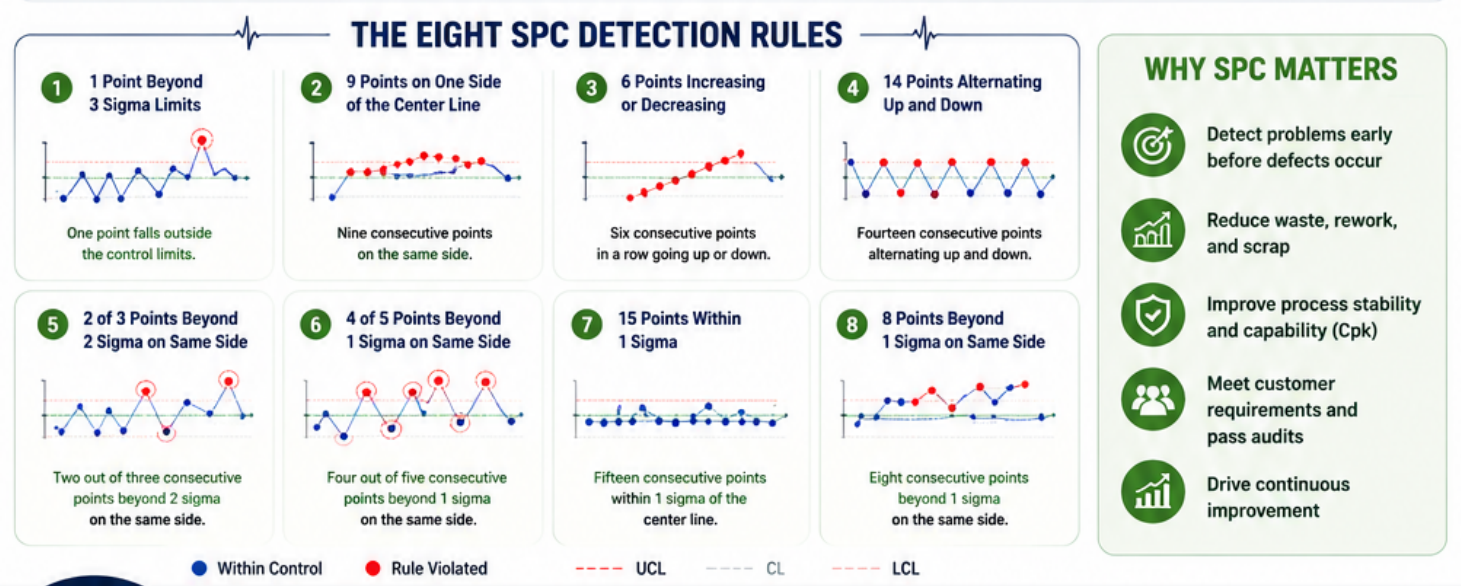
To detect process changes even earlier, modern quality systems—including ISO-based quality practices and classic Western Electric rules—use a set of Eight SPC Detection Rules.
These rules look not only at individual points but also at patterns within the data.
Examples include:
Rule 1
One point falls outside the 3-Sigma control limits.
This is an extremely rare event under normal conditions.
Rule 2
Nine consecutive points fall on the same side of the center line.
This is similar to flipping a coin and getting the same result nine times in a row—possible, but statistically unlikely.
It often indicates that the process average has shifted.
Rule 3
Six consecutive points continuously increase or decrease.
This usually indicates a directional trend, such as progressive tool wear or gradual equipment drift.
The remaining rules operate on the same principle:
They identify situations that should rarely occur in a stable process.
SPC Detection Rules Are Like Invisible Safety Nets
The Eight SPC Rules can be thought of as eight invisible safety nets spread across the control chart.
Whenever production data triggers one of these rules, it effectively crosses a statistical warning threshold.
The SPC system immediately:
- Identifies the abnormal pattern
- Generates an alert
- Notifies responsible personnel
- Enables corrective action before defects occur
This allows manufacturers to achieve:
Automated Quality Monitoring · Real-Time Detection · Zero-Delay Response

Conclusion
The three sentences at the beginning of this article are tightly connected:
1. SPC Control Charts convert production data into dynamic visual trends.
2. SPC identifies abnormalities by detecting statistically unlikely events.
3. Those unlikely events are defined through the Normal Distribution and the Eight SPC Detection Rules.
Together, they reveal the true purpose of SPC:
Not inspection after defects occur, but prevention before defects occur.
SPC transforms quality management from a reactive activity into a predictive science powered by mathematics and probability.
The more you revisit these three simple sentences, the more you will understand not only SPC—but also how modern manufacturing uses statistical science to turn uncertainty into process control and continuous improvement.