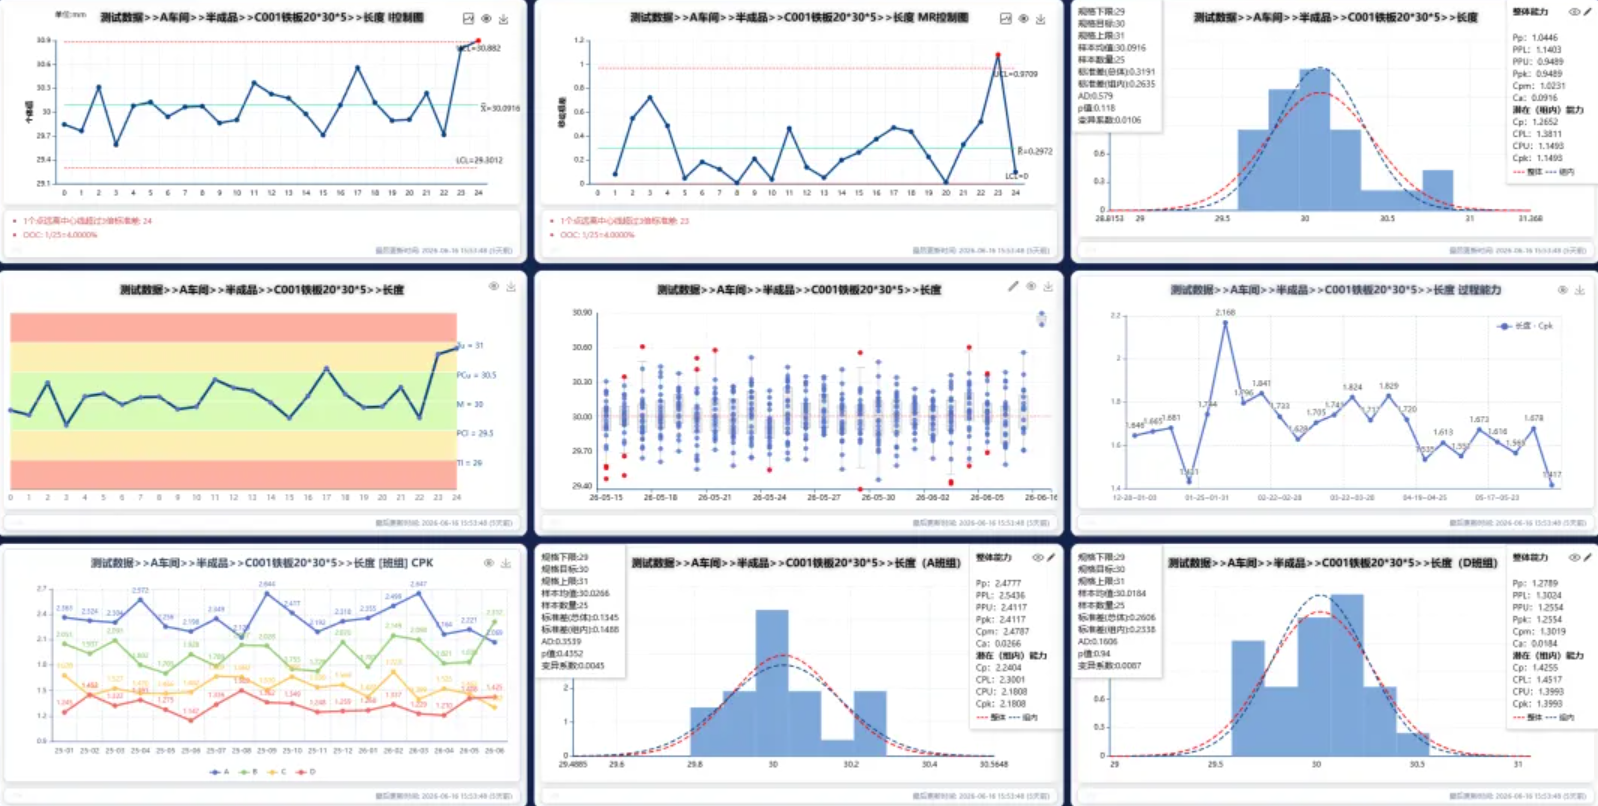
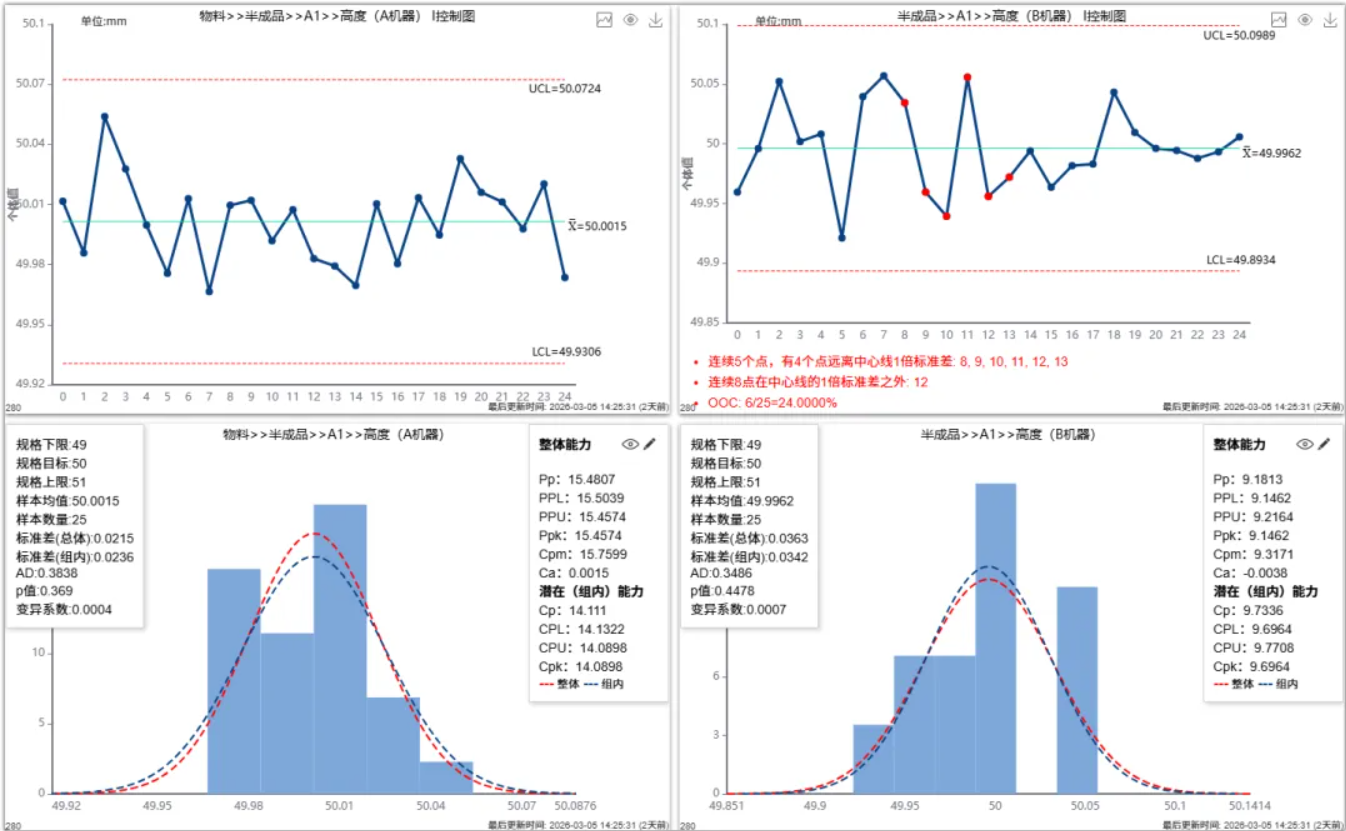
SPC Dashboard: Building the Real-Time Monitoring Hub for Smart Factories
NEXSPC dashboard enables real-time monitoring, data-driven insights, and proactive quality control for efficient, stable production.…
Technical articles and insights on NEXSPC and Statistical Process Control (SPC).
Keyword "Control Chart" found 10 articles (current page)
NEXSPC dashboard enables real-time monitoring, data-driven insights, and proactive quality control for efficient, stable production.…
Break free from the legacy SPC subscription trap. Discover why modern manufacturers are replacing Minitab and InfinityQS with NexSPC 4.0—a pure Web-based, real-time SPC software featuring a disruptive unlimited perpetual license for true Industry 4.0 quality control.…
Discover the 5 non-negotiable prerequisites for CPK calculation under the new AIAG-VDA SPC manual. Learn why MSA, control charts, normality tests, 25 subgroups, and data traceability are mandatory for process capability, and how NEXSPC 4.0 automates compliance.…
Discover the hidden mathematical and engineering logic behind the golden rule of using 25 subgroups in SPC and CPK analysis. Learn how it perfectly balances statistical accuracy with real-time anomaly traceability…
Simple SPC has created 6 control chart dashboards for subgroup-type testing items. You can choose to use different charts to display the same testing item, or use different charts to display multiple testing items.…
Simple SPC has created six control chart dashboards for single inspection items, allowing for a clear and intuitive understanding of the production status from multiple dimensions.…
Simple SPC implements a stepped control limit algorithm, full control chart cupport for variable subgroups, and process capability analysis.…
AI-SPC integrates machine learning with traditional SPC, enabling predictive quality management.…
This article provides an in-depth explanation of the calculation of control limits for Xbar-R and Xbar-S control charts in SPC analysis.…
When discussing quality anomaly analysis, almost everyone familiar with the field will mention SPC (Statistical Process Control) control charts. Indeed, SPC control charts are currently the most widely used tool for quality anomaly analysis…