Have you ever discovered a large batch of defective products only after final inspection?
The result is often rework, scrap, delayed delivery, increased costs, or even customer complaints.
This is a common challenge in traditional quality management, where quality issues are detected only after production has been completed.
The problem is simple:
Inspection can detect defects, but it cannot prevent defects from occurring.
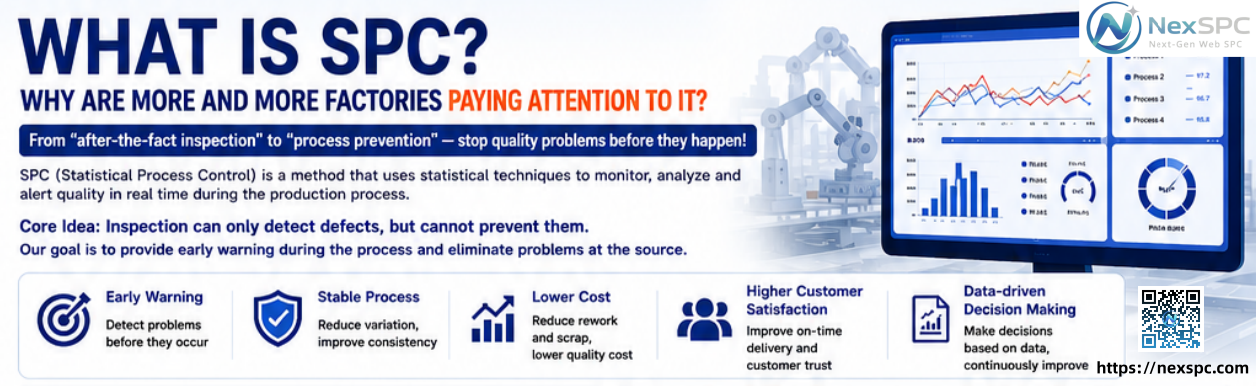
This is exactly where SPC (Statistical Process Control) creates value.
SPC shifts quality management from post-production inspection to real-time process prevention.
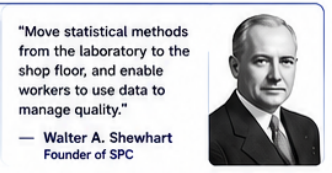
First introduced by Dr. Walter A. Shewhart in 1924, SPC remains one of the most important quality management methodologies in modern manufacturing.
1. What Is SPC?
SPC stands for Statistical Process Control.
It is a quality management methodology that uses statistical techniques to continuously monitor, analyze, and control manufacturing processes.
The core philosophy of SPC is straightforward:
Quality is not inspected into a product—it is built into the process.
In other words:
- Inspecting finished products only separates good parts from bad parts.
- Monitoring the production process helps identify problems before defects occur.
- When the process is stable, product quality becomes stable.
Therefore, SPC is fundamentally a preventive quality management approach.
SPC focuses not only on whether defects exist, but also on:
- Process stability
- Normal versus abnormal variation
- Emerging trends
- Potential process deterioration
World-class manufacturers achieve quality not through stricter final inspections, but through more stable processes.
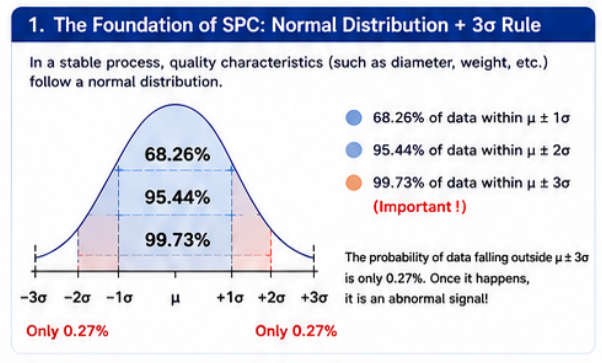
2. Statistical Foundations of SPC: Normal Distribution and the 3-Sigma Principle
SPC is built upon two key statistical concepts:
- Normal Distribution
- The 3-Sigma Principle
Under stable production conditions, quality characteristics such as dimensions, weight, thickness, and performance measurements typically follow a normal distribution.
Characteristics of a normal distribution include:
- Most data points cluster around the mean.
- Fewer observations appear as values move away from the center.
- The distribution forms a bell-shaped curve.
According to statistical theory:
- 68.26% of observations fall within ±1σ.
- 95.44% fall within ±2σ.
- 99.73% fall within ±3σ.
As a result, any data point outside the ±3σ range has only a 0.27% probability of occurring naturally.
This suggests that such an event is likely caused by an abnormal process condition rather than random variation.
This principle forms the theoretical basis of SPC control limits:
- UCL (Upper Control Limit)
- LCL (Lower Control Limit)
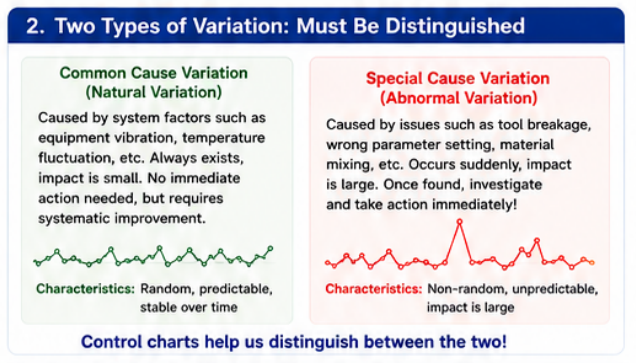
3. The Most Important Function of SPC: Distinguishing Two Types of Variation
The true value of SPC goes beyond charting data.
Its primary purpose is helping organizations distinguish between:
- Common Cause Variation
- Special Cause Variation
Common Cause Variation
Common causes are natural fluctuations that are inherent in a process.
Examples include:
- Minor machine vibration
- Environmental temperature and humidity changes
- Normal material variation
- Small differences between operators
These variations:
- Exist continuously
- Have limited impact
- Cannot be completely eliminated
- Usually do not require immediate corrective action
They represent the inherent capability of the process.
Improvement efforts should focus on optimizing the overall system rather than constantly adjusting process settings.
Special Cause Variation
Special causes are abnormal, unexpected events that disrupt process stability.
Examples include:
- Tool breakage
- Incorrect machine settings
- Program errors
- Material mix-ups
- Equipment failures
- Measurement system issues
These variations typically:
- Occur suddenly
- Have significant impact
- Cause the process to become unstable
- Require immediate investigation
One of the greatest strengths of SPC control charts is their ability to rapidly identify these abnormal conditions.
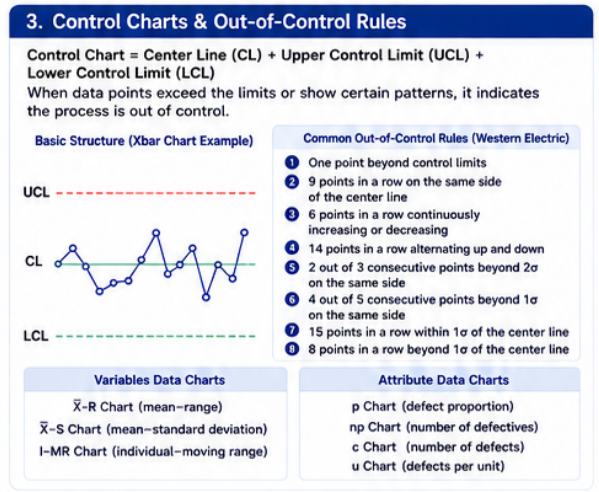
4. Control Charts: The Core Tool of SPC
A Control Chart is the most widely used and essential SPC tool.
A standard control chart consists of:
- Center Line (CL)
- Upper Control Limit (UCL)
- Lower Control Limit (LCL)
When a process is stable, data points fluctuate randomly within the control limits.
However, the process may be out of control when:
- A point exceeds a control limit
- Multiple points fall consistently on one side of the center line
- A continuous upward or downward trend appears
- Cyclical or systematic patterns emerge
These conditions are identified using SPC out-of-control rules.
Common rules include:
- One point beyond 3σ
- Nine consecutive points on the same side of the center line
- Six consecutive increasing or decreasing points
- Fourteen consecutive alternating points
These rules are based on the detection of statistically unlikely events that rarely occur in a truly random process.
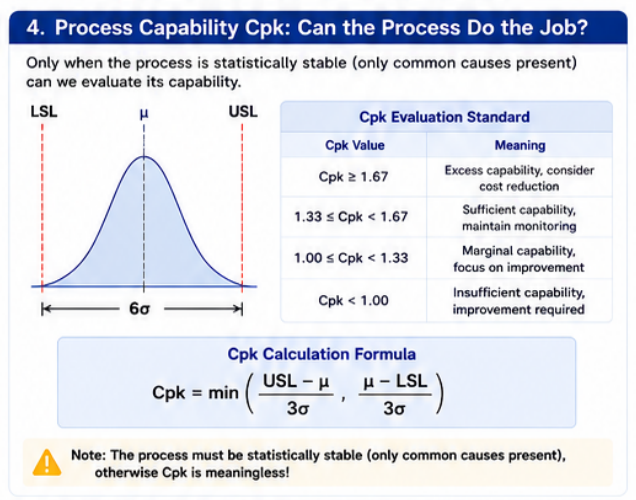
5. Process Capability Analysis: Is the Process Capable?
Once a process is statistically stable, the next question becomes:
Can the process consistently meet specifications?
This is where Process Capability Analysis comes into play.
The two most commonly used indices are:
- Cp、Cpk
Cp: Process Potential Capability
Cp evaluates whether the natural process variation is smaller than the specification range.
A higher Cp value indicates less process variation and greater potential capability.
Cpk: Process Performance Capability
Cpk considers both:
- Process variation
- Process centering
Because it accounts for process shift, Cpk provides a more realistic assessment of manufacturing capability.
Common Capability Guidelines
| Cpk Value | Capability Assessment | Recommendation |
|---|---|---|
| ≥ 1.67 | Excellent Capability | Consider cost optimization |
| 1.33 – 1.67 | Capable Process | Maintain monitoring |
| 1.00 – 1.33 | Marginal Capability | Improvement recommended |
| < 1.00 | Insufficient Capability | Immediate improvement required |
A critical point to remember:
Cpk is meaningful only when the process is statistically in control.
If the process is unstable, any capability index becomes unreliable.
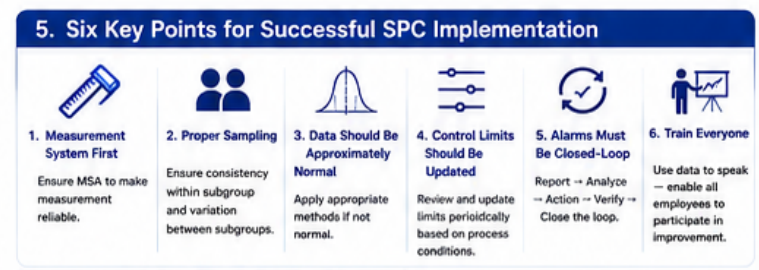
6. Six Critical Factors for Successful SPC Implementation
Many companies implement SPC but fail to achieve expected results.
The issue is often not the software—it is the foundation.
(1)Ensure Measurement System Reliability (MSA)
If measurement data is inaccurate, all subsequent analysis becomes meaningless.
Measurement System Analysis (MSA) should be completed before SPC deployment.
(2)Use Proper Sampling Methods
Sampling strategy directly affects control chart performance.
Best practices include:
- Maintaining consistency within subgroups
- Reflecting time-based variation between subgroups
(3) Verify Data Distribution
SPC and capability analysis generally assume normal distribution.
Severely skewed data may require transformation before analysis.
(4)Update Control Limits Periodically
Control limits should not remain unchanged indefinitely.
As equipment, materials, and processes evolve, control limits should be reviewed and optimized accordingly.
(5)Establish Closed-Loop Corrective Action
Many organizations generate alarms but fail to resolve underlying problems.
An effective SPC system should support:
Detection → Root Cause Analysis → Corrective Action → Verification → Prevention
(6)Build a Data-Driven Culture
SPC is not solely a quality department responsibility.
Successful implementation requires:
- Operators recognizing abnormalities
- Process engineers analyzing trends
- Management driving continuous improvement
Only when decisions are driven by data can SPC deliver its full value.
7. Why Traditional SPC Is No Longer Enough for Modern Manufacturing
As Industry 4.0 and Smart Manufacturing continue to evolve, traditional SPC systems face new challenges:
- Massive increases in data volume
- High-frequency data collection
- Real-time monitoring requirements
- Growing demand for predictive quality management
Common issues include:
- Excessive false alarms
- Difficulty detecting long-term process drift
- Small oscillations masking real abnormalities
- Poor alarm management
- Limited root cause traceability
- Lack of control chart expertise among shop-floor personnel
As a result, many manufacturers find themselves flooded with alarms while still missing critical process issues.
SPC must evolve from a statistical tool into a true process intelligence platform.
8. NexSPC: Beyond Traditional SPC Software
Unlike conventional SPC solutions, NexSPC focuses on helping manufacturers reduce false alarms, improve abnormality detection, and strengthen process execution.
Advanced High-Frequency Data Analysis
For modern automated production lines with:
- Second-level sampling
- Millisecond-level sampling
- Full-volume data monitoring
Traditional SPC rules often generate excessive alarms.
NexSPC introduces advanced technologies such as:
- Sliding Window Extreme Value Analysis
- Baseline and Oscillation Separation Technology
- Long-Term Drift Detection
- Micro-Abnormal Trend Recognition
These capabilities help distinguish:
- True abnormalities
- High-frequency oscillations
- Normal variation
- Gradual process drift
Resulting in higher detection accuracy and fewer false alarms.
Closed-Loop Exception Management
Many SPC systems stop at alarm generation.
NexSPC emphasizes complete problem resolution.The platform supports:
- Exception registration
- Root cause analysis
- Responsibility tracking
- Corrective action records
- Effectiveness verification
- Historical traceability
This creates a complete digital closed-loop process while building a valuable organizational knowledge base.
Real-Time Monitoring for Industry 4.0
NexSPC supports:
- Real-time data collection
- Multi-device connectivity
- Automatic control chart generation
- Multi-level alarm management
- Instant message notifications
- Large-screen dashboards
- Multi-site centralized management
Transforming SPC from a retrospective analysis tool into a real-time process monitoring platform.
Designed for Shop-Floor Adoption
Traditional SPC systems are often usable only by quality engineers.
NexSPC focuses on usability across all manufacturing roles.Features include:
- Intuitive abnormality visualization
- Automatic rule evaluation
- Visual trend analysis
- Simplified operation workflows
- Guided corrective action processes
This enables operators, supervisors, engineers, and managers to actively participate in quality improvement.
The result is true data-driven continuous improvement.
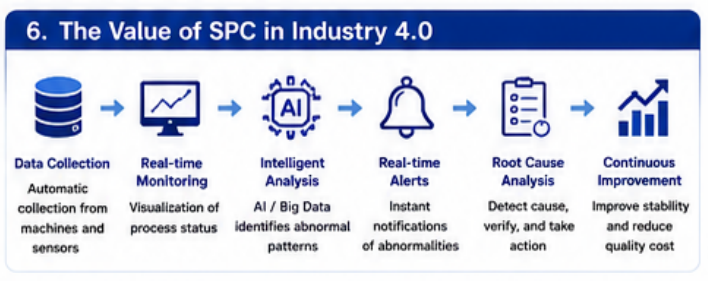
9. The Future of SPC in the Industry 4.0 Era
SPC continues to evolve alongside Industry 4.0 and Smart Manufacturing.
Traditional SPC relied heavily on manual data collection and offline analysis.
Today's advanced SPC systems increasingly provide:
- Automated machine data acquisition
- Real-time control chart monitoring
- Automatic abnormality detection
- AI-assisted pattern recognition
- High-frequency big data analytics
New technologies such as:
- Baseline and Oscillation Separation
- Sliding Window Analysis
- AI-Assisted Exception Detection
- Intelligent Closed-Loop Management
are transforming SPC from a statistical quality tool into a real-time process intelligence platform.
Conclusion
More than 100 years after its creation, SPC remains as relevant as ever.
Its fundamental principles have not changed:
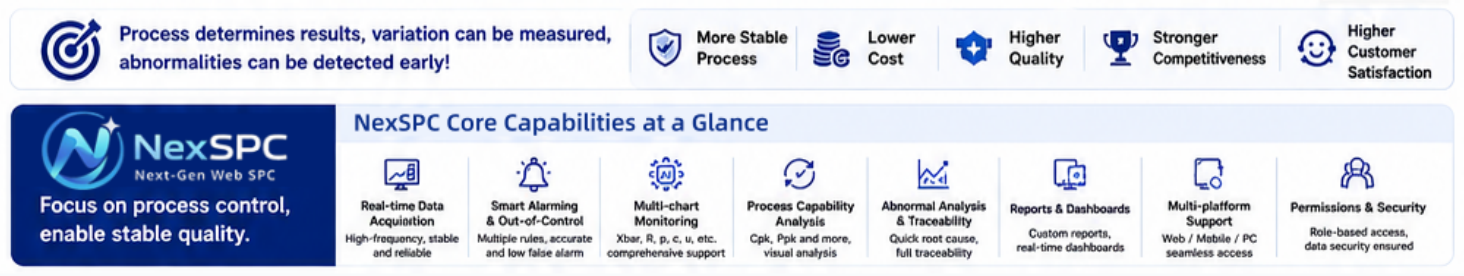
- Process determines results.
- Variation can be measured.
- Abnormalities can be detected before defects occur.
The most effective quality management strategy is not catching defects at final inspection.
It is preventing defects during production.
That is the true value of SPC.