


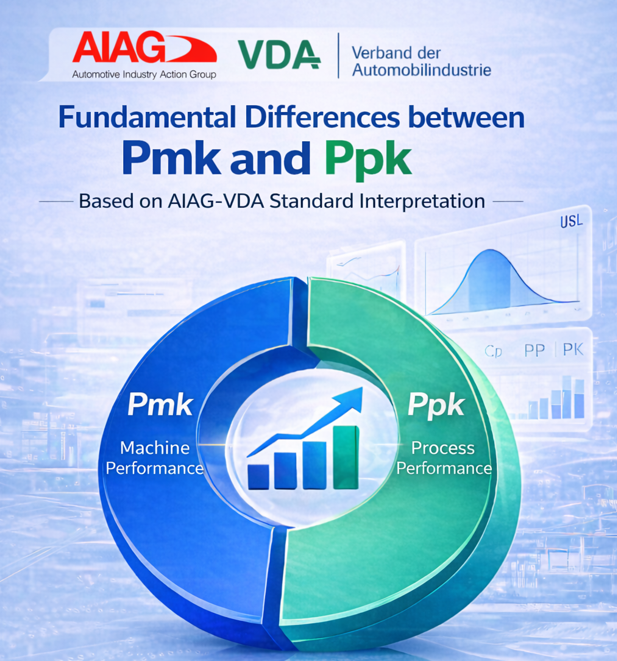
The latest SPC manual jointly released by AIAG and VDA introduces a new index—Pmk (Machine Performance Index).
However, many practitioners find that Pmk looks very similar to Ppk, and some even consider it to be the same concept or merely a rebranding.
So, are Pmk and Ppk really the same?
1. Same Mathematical Foundation: Why Do They Look Identical?
First, we must acknowledge an important fact:
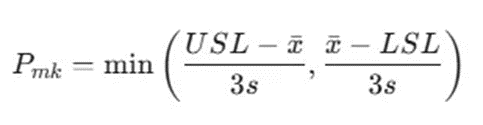
At the mathematical level, Pmk and Ppk are identical.
Whether using:
- The classical formula based on mean and standard deviation under normal distribution, or
- The generalized geometric (percentile-based) method introduced in the 2026 AIAG-VDA SPC manual for non-normal data
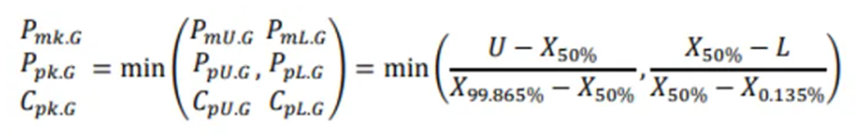
The calculation logic remains the same.
In essence, both indices do the same thing:
They compare the spread and centering of actual data against the specified tolerance limits.
If the “measuring tool” is the same, then where does the difference come from?
The answer lies in what you are measuring with that tool.
2. Source of Variation: The Fundamental Difference
The essence of quality management is the control of variation. Traditionally, sources of variation are summarized as the “5M”:
- Man
- Machine
- Material
- Method
- Milieu (Environment)
The fundamental difference between Pmk and Ppk lies in how they treat these 5M factors.
2.1 Pmk: A “Single-Variable” Test Under a Microscope
Pmk stands for Machine Performance Index. As the name suggests, it focuses solely on variation caused by the Machine.
To isolate the intrinsic performance of the machine, the other four factors must be strictly controlled or “frozen”:
- Man: The same skilled operator must be used to eliminate human variation
- Material: The same batch of uniform raw material must be used
- Method & Environment: The machine must be fully warmed up, no interruptions or tool changes are allowed, and environmental conditions must remain stable
Under such tightly controlled conditions, the variation in product characteristics is almost entirely determined by:
- Machine precision
- Spindle runout
- Guideway clearance
- Other inherent mechanical factors
The resulting Pmk reflects the variation attributable to the machine itself.
2.2 Ppk: A “Panoramic” View of the Entire Process
Ppk stands for Process Performance Index, where “process” represents a broader, system-level concept.
When calculating Ppk:
We do not freeze the other 4M factors—instead, the data is expected to include all real-world variations:
- Different operators across shifts
- Environmental changes over time
- Variations in material batches or suppliers
- Multiple machines or production conditions
Ppk evaluates the ability of the entire production system to consistently produce conforming products under real operating conditions.
3. Practical Application: When to Use Pmk vs Ppk
Once the difference in variation sources is understood, their application scenarios become clear.
Machine Acceptance and Release
When you invest in a new machine or complete a major overhaul, you need to determine whether the machine itself is capable.
In this case, Pmk must be used.
If Pmk does not meet the requirement (typically ≥1.67 or higher), it indicates that:
- The machine itself has inherent limitations
- Even with the best operators and materials, good products cannot be consistently produced
Production Approval and Process Evaluation (PPAP & Process Study)
After the machine is validated and enters mass production, customers (e.g., OEMs) are no longer concerned with machine capability alone.
They care about:
Whether the production system can consistently deliver conforming products
In this case:
Ppk studies are required, typically with acceptance criteria such as ≥1.33 or ≥1.67.
4. Data Collection Strategy Comparison
To align with their respective purposes, the 2026 SPC manual provides distinct sampling guidelines:
Pmk (Machine Performance Index)
- Objective: Diagnose the intrinsic precision of a single machine
- Variation Source: Extremely narrow (Machine only)
- Typical Stage:
- New machine acceptance
- After major maintenance
- After fixture/tooling changes
- Sampling Strategy:
- 50–100 consecutive parts
- Continuous production
- No interruption or adjustment
- Time Span:
- Very short (often within minutes)
Ppk (Process Performance Index)
- Objective: Evaluate the overall capability of the production system
- Variation Source: Broad (all 5M factors)
- Typical Stage:
- Trial production
- PPAP submission
- Early mass production
- Sampling Strategy:
- At least 125 parts
- Typically 25 subgroups (e.g., 5 parts each)
- Time Span:
- Longer duration (days or weeks)
- Must capture representative process variation
Conclusion
Within a quality control system, Pmk and Ppk are not redundant metrics, but rather distinct diagnostic tools used at different stages.
- Pmk represents the baseline—it defines the upper limit of process capability
(a poor machine cannot produce a capable process) - Ppk represents reality—it reflects how well the entire production system performs under real-world conditions
Understanding the difference is not about formulas, but about recognizing the conditions under which the data is generated.