


In modern manufacturing, visual monitoring of production processes has become a key factor in improving quality management.
The dashboard function of NEXSPC software is a powerful tool designed to address this need. It transforms traditional quality management from “post-event correction” to “pre-event warning,” bringing significant efficiency improvements to enterprises.
1. Core Features
Unlimited Customizable Dashboards
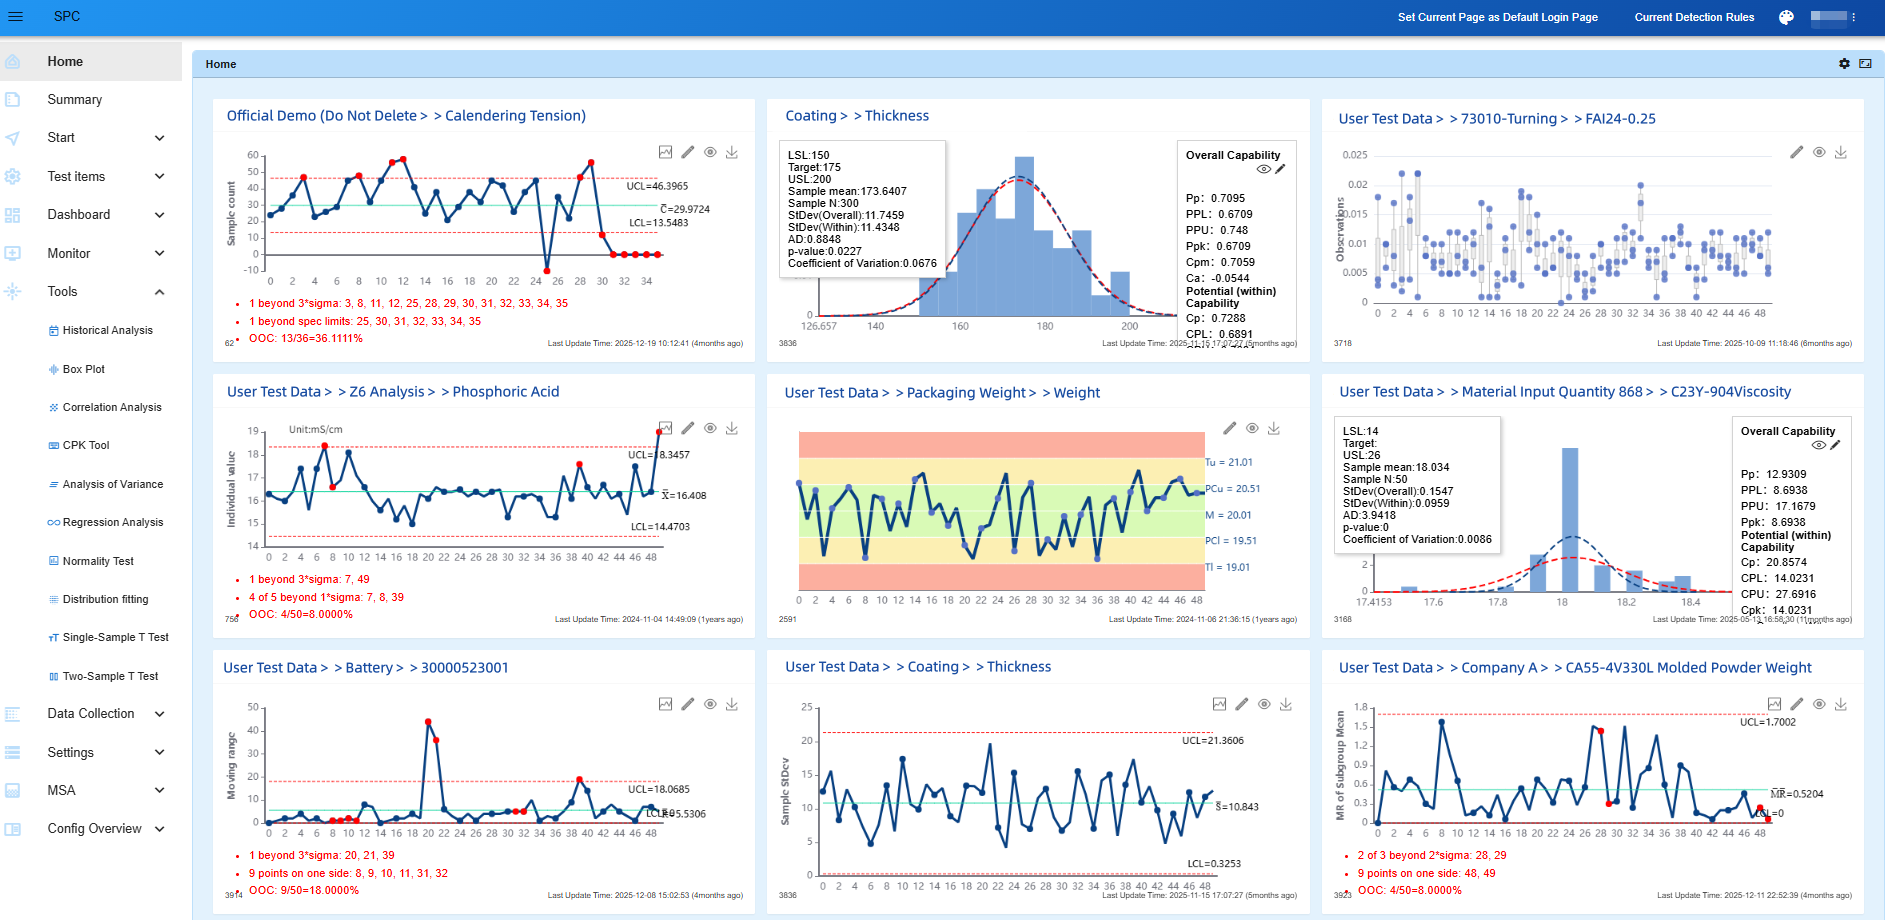
NEXSPC software supports creating an unlimited number of dashboard pages, and each page can freely include multiple chart types:
- SPC Control Charts: Real-time monitoring of process stability
- Rainbow Charts (Pre-control Charts): Intuitive display of product qualification rates
- Capability Analysis Histograms: Evaluation of process capability indices
Real-Time Data Update Mechanism
Dashboard data achieves millisecond-level automatic updates without manual refresh:
- After backend database updates (manual entry, Excel upload, API synchronization), control charts update automatically
- Recalculation of rule violations ensures monitoring timeliness
- Supports multi-source data acquisition, including serial servers, MQTT, TCP, and other modes
Flexible Abnormal Warning System
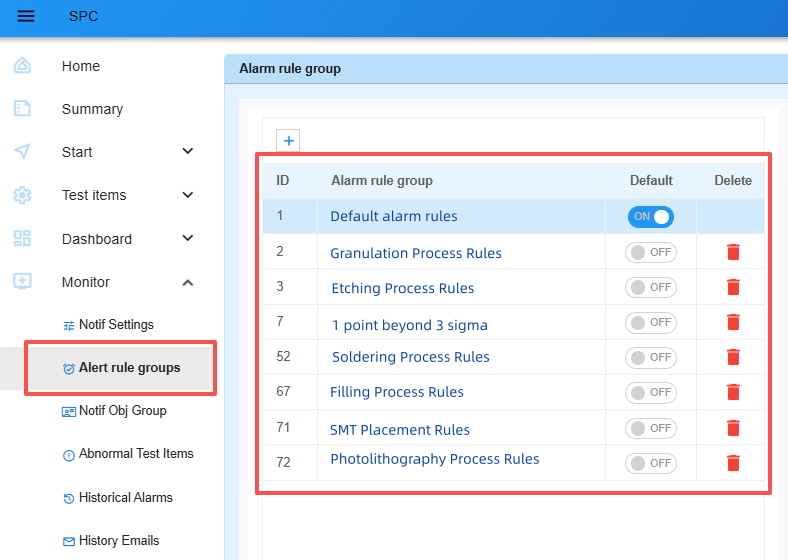
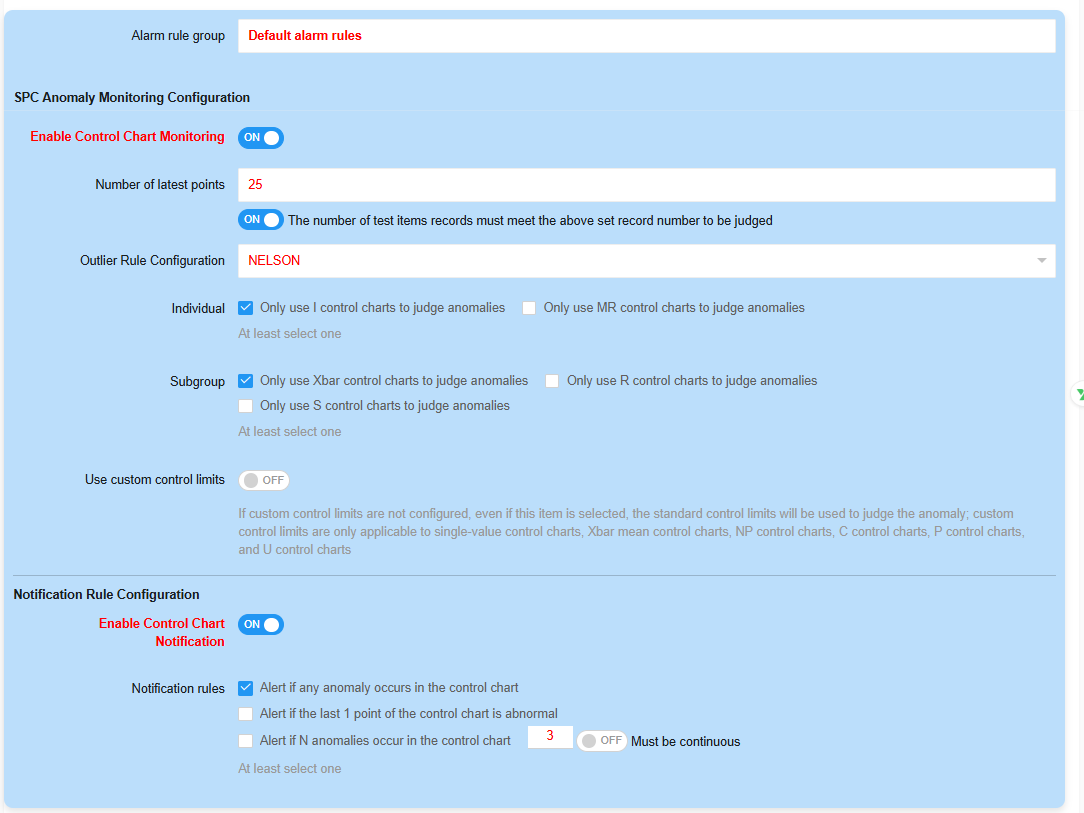
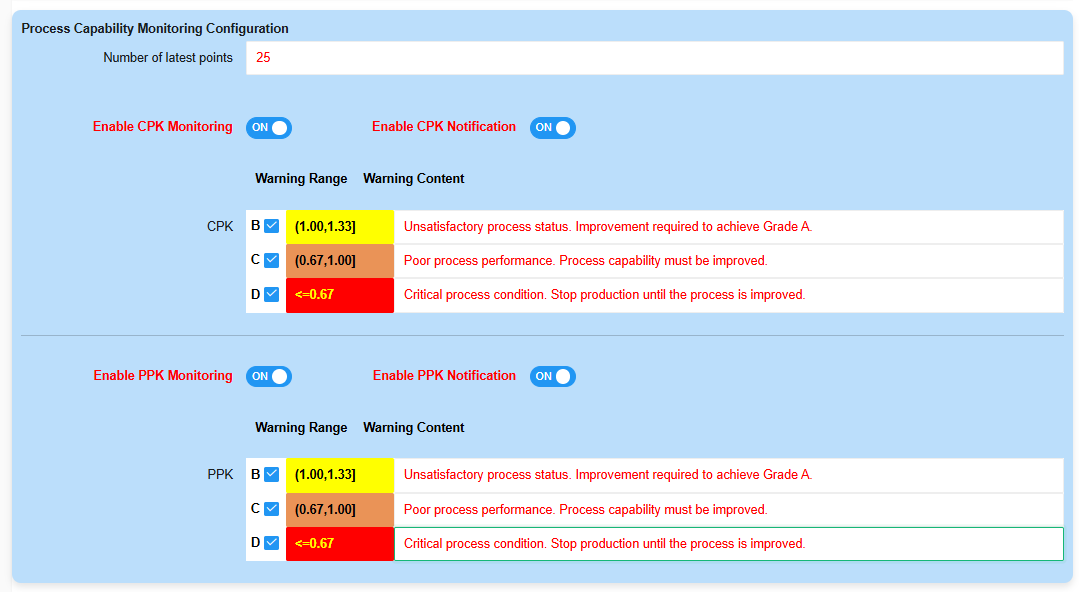
The dashboard integrates a powerful alert system, allowing flexible configuration:
- Separation of rule violation rules and alert rules: precise control of alert triggering conditions
- Multi-channel notifications: email, WeCom, DingTalk, and other real-time push methods
- Hierarchical warning mechanism: different response measures based on severity levels
Multi-Dimensional Data Comparison Analysis
- The dashboard supports displaying multiple inspection items or different dimensions of the same item on a single interface:
- Grouped display by machine, production line, shift, etc.
- Supports comparison of key indicators such as CPK, PPK, and number of abnormal points
- Visual presentation of quality differences from different sources to support optimal resource allocation
2. Practical Applications for Improving Production Efficiency
Workshop-Level Real-Time Monitoring

Deploy large-screen dashboards in workshops to achieve:
- Instant anomaly detection: production line abnormalities are captured at the moment they occur, preventing batch quality issues
- Reduced inspection costs: quality personnel can grasp the overall situation through dashboards without frequent on-site inspections
- Faster response speed: significantly shorten the time from anomaly occurrence to handling, reducing downtime losses
Data Support for Quality Decision-Making
The dashboard provides comprehensive quality data analysis to support scientific decision-making:
- Equipment performance evaluation: compare machine stability through CPK values and allocate high-value orders accordingly
- Process optimization basis: identify root causes of process variation and improve process parameters in a targeted manner
- Supplier quality comparison: evaluate the impact of different suppliers’ raw materials on product quality
Improved Cross-Department Collaboration Efficiency
- As a unified quality information platform, the dashboard promotes efficient collaboration across departments:
- Production department: understand product quality status in real time and adjust process parameters promptly
- Quality department: quickly locate root causes and reduce quality disputes
- Equipment department: predict maintenance needs based on quality variation trends
- Management: gain an overall view of quality status to support strategic decision-making
3. Technical Advantages and Deployment
- Go live within 1 day
- Affordable pricing (tens of thousands level)
- Unlimited users, unlimited online users, unlimited data points, unlimited dashboards, one account per user
- All users access via browser
- Server-based licensing with one-time lifetime authorization, no annual fees
- Supports SPC control charts: I-MR, Xbar-S, Xbar-R, MR-R/S, NP, C, P, U
- Fully supports the eight standard SPC rule violation rules (and custom rules)
- Multiple data input methods: online manual entry, online Excel import, HTTP interface synchronization, TCP server mode, MQTT mode, OPC data acquisition
- One-click generation of comprehensive SPC analysis reports: control charts, normality tests, rainbow charts, box plots, distribution fitting, process capability histograms, machine learning rule detection charts, capability comparison charts, data summaries, large-model interpretation
- Create unlimited SPC monitoring dashboards: dynamic dashboards, comprehensive dashboards, statistical dashboards, including SPC control charts, rainbow charts, histograms, and box plots for any inspection items, ideal for workshop large screens
- Backend monitoring: SPC control chart rule violations, CPK and PPK anomaly monitoring
- Notification channels: email, WeCom, DingTalk, Feishu, MQTT, APIs
- Real-time automatic updates of control charts
- 11 language versions
- Multiple analysis tools: CPK tools, regression analysis, correlation analysis, normality tests, one-sample T-test, two-sample T-test, distribution fitting, etc.
- Open SPC rule detection APIs and other interfaces for data synchronization and inspection item creation
- Integrated MSA
- Private deployment within enterprise intranet, secure and controllable data, browser-based with no client installation required