


SPC Stratified Analysis and Practical Solutions Based on 5M1E**
When the CPK (Process Capability Index) in a manufacturing process fails to meet requirements (for example, below 1.0 or even as low as 0.78), blindly adjusting machine parameters often delivers very limited results.
Based on nearly 20 years of manufacturing data analysis and quality management experience, this article explains how to use SPC stratified analysis based on the “Man, Machine, Material, Method, Environment, and Measurement” (5M1E) framework.
By accurately identifying the core source of variation (such as differences between operator teams), enterprises can not only improve process capability through targeted actions, but also ensure delivery quality for high-value customers in the short term through dynamic order routing strategies.
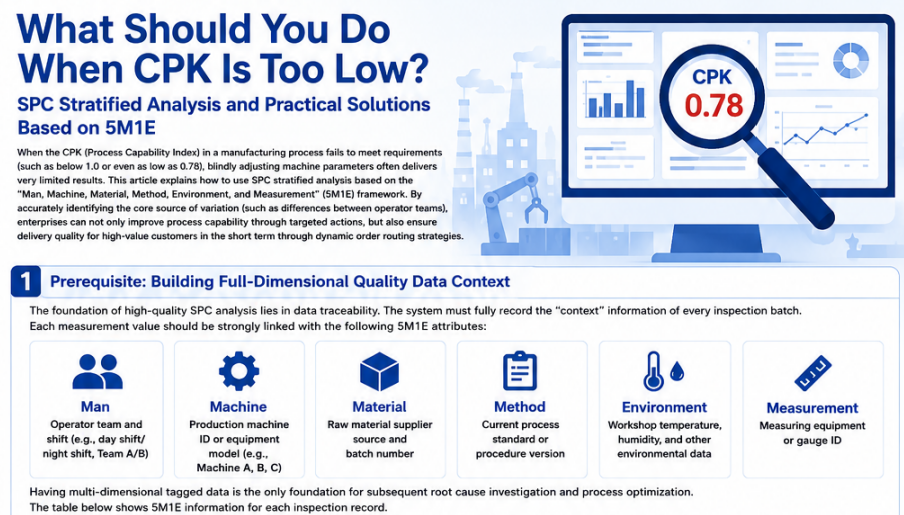
1. Prerequisite: Building Full-Dimensional Quality Data Context
When dealing with any CPK issue, data without business context is merely a collection of meaningless numbers.
The foundation of high-quality Statistical Process Control (SPC) analysis lies in data traceability.
In standard digital manufacturing practices, the system must fully record the “context” information of every inspection batch.
This means every measurement value should be strongly linked with the following 5M1E attributes:
- Man: Operator team and shift (such as day shift/night shift, Team A/Team B)
- Machine: Production machine ID or equipment model (such as Machine A, B, or C)
- Material: Raw material supplier source and batch number
- Method: Current process standard or procedure version
- Environment: Workshop temperature, humidity, and other environmental data during production
- Measurement: Measuring equipment or gauge ID used for inspection
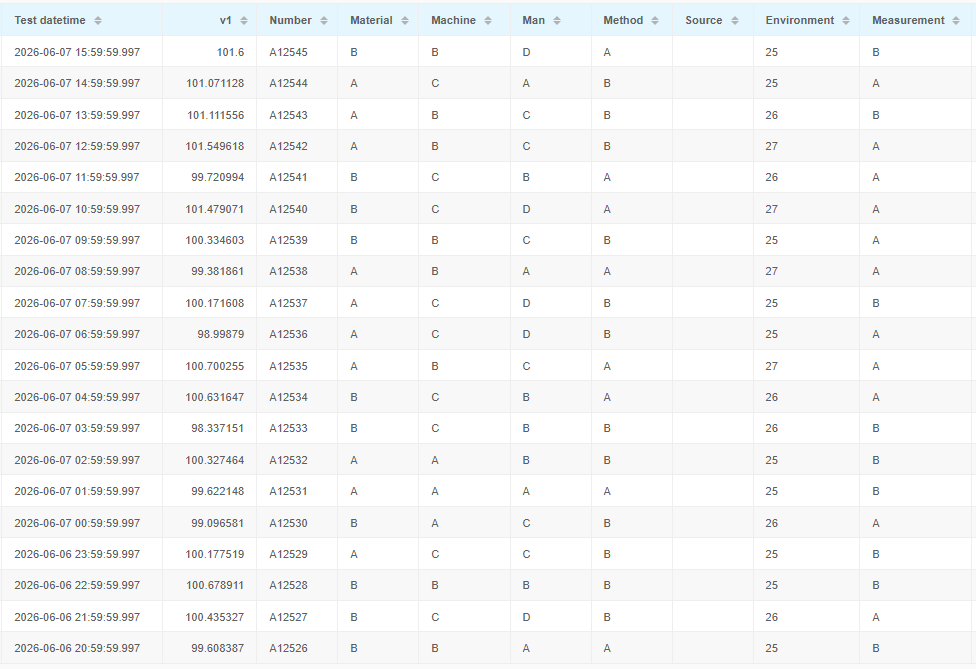
Having multi-dimensional tagged data is the only foundation for subsequent root cause investigation and process optimization.
For example, in the inspection dataset below, every row (every inspection record) contains complete 5M1E information.
2. Analysis: Using SPC Stratified Analysis to Identify the Root Cause
Facing an overall low CPK of 0.78, we need to use statistical “slicing” and “stratification” methods to uncover the true source of variation hidden behind the average values.
Using the inspection data example above, the following is a typical investigation path:
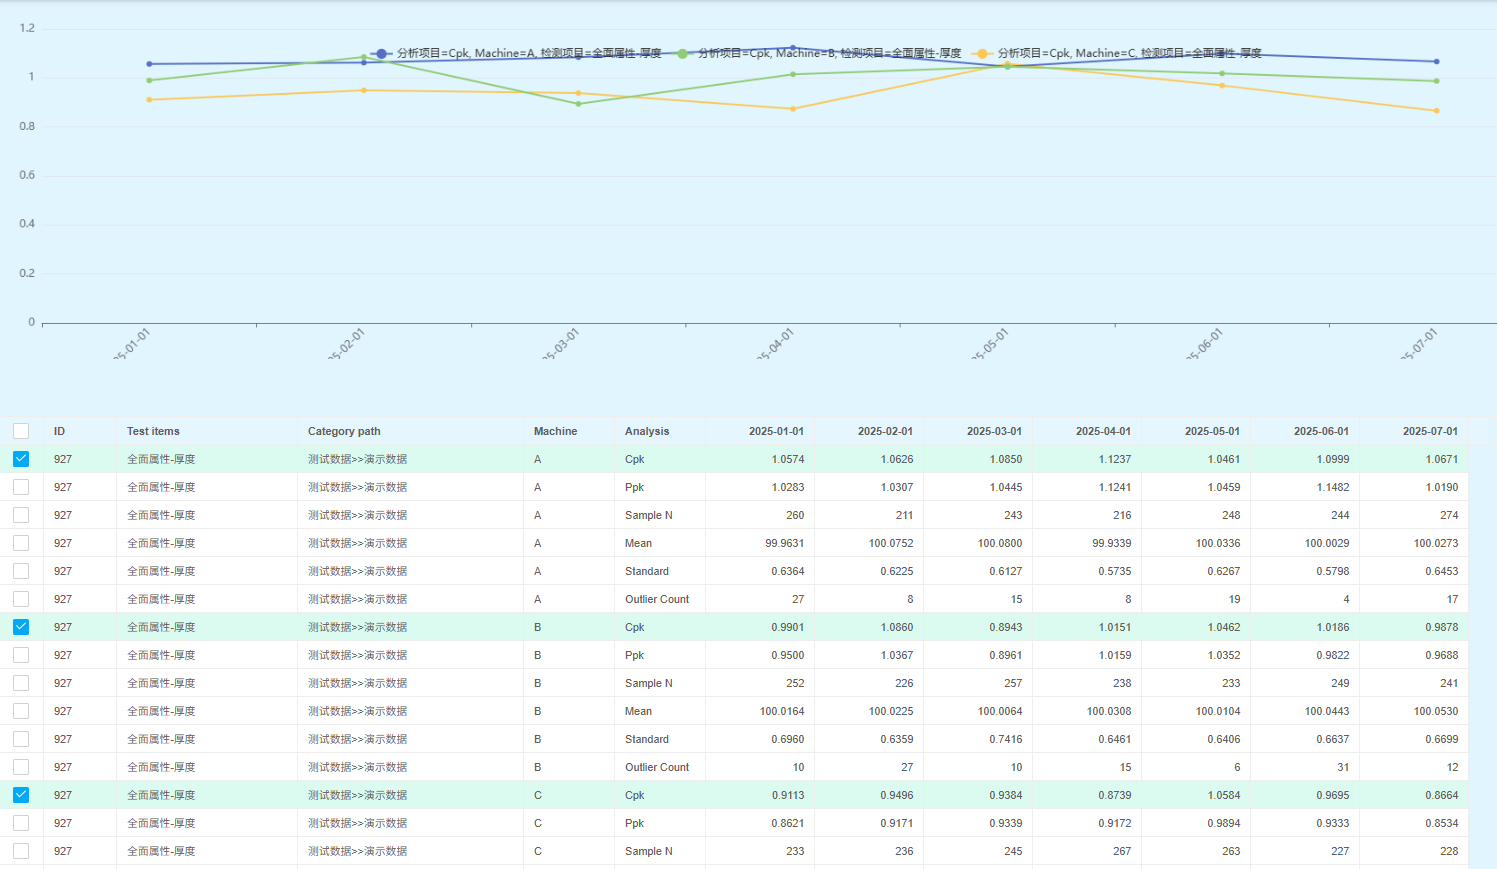
2.1 Dimension One: Investigating the “Machine” Factor and Eliminating Secondary Variables
First, classify historical data by production machine.
Overlay and compare the CPK trend charts of Machines A, B, and C within the SPC system.
If the analysis shows that the CPK curves of all three machines are generally similar, with overall performance remaining close (for example, Machine C only shows a slight statistical disadvantage), then:
Preliminary Conclusion:
The hardware equipment (machines) is not the primary factor causing the low CPK.
The investigation direction should therefore shift to avoid ineffective equipment maintenance and unnecessary downtime.
The figure below shows the CPK trend charts of Machines A, B, and C.
2.2 Dimension Two: Investigating the “Operator Team” Factor and Identifying the Core Variable
After excluding machine-related factors, stratify the data by operator teams (“Man”).
Retrieve and compare the CPK data of Team A, Team B, Team C, and Team D.
At this stage, significant differences in the data often become very clear:
- Team A: Concentrated data distribution, low variation, and excellent CPK performance far above the average level
- Teams B, C, and D: CPK values significantly lower than Team A, severely dragging down the overall CPK
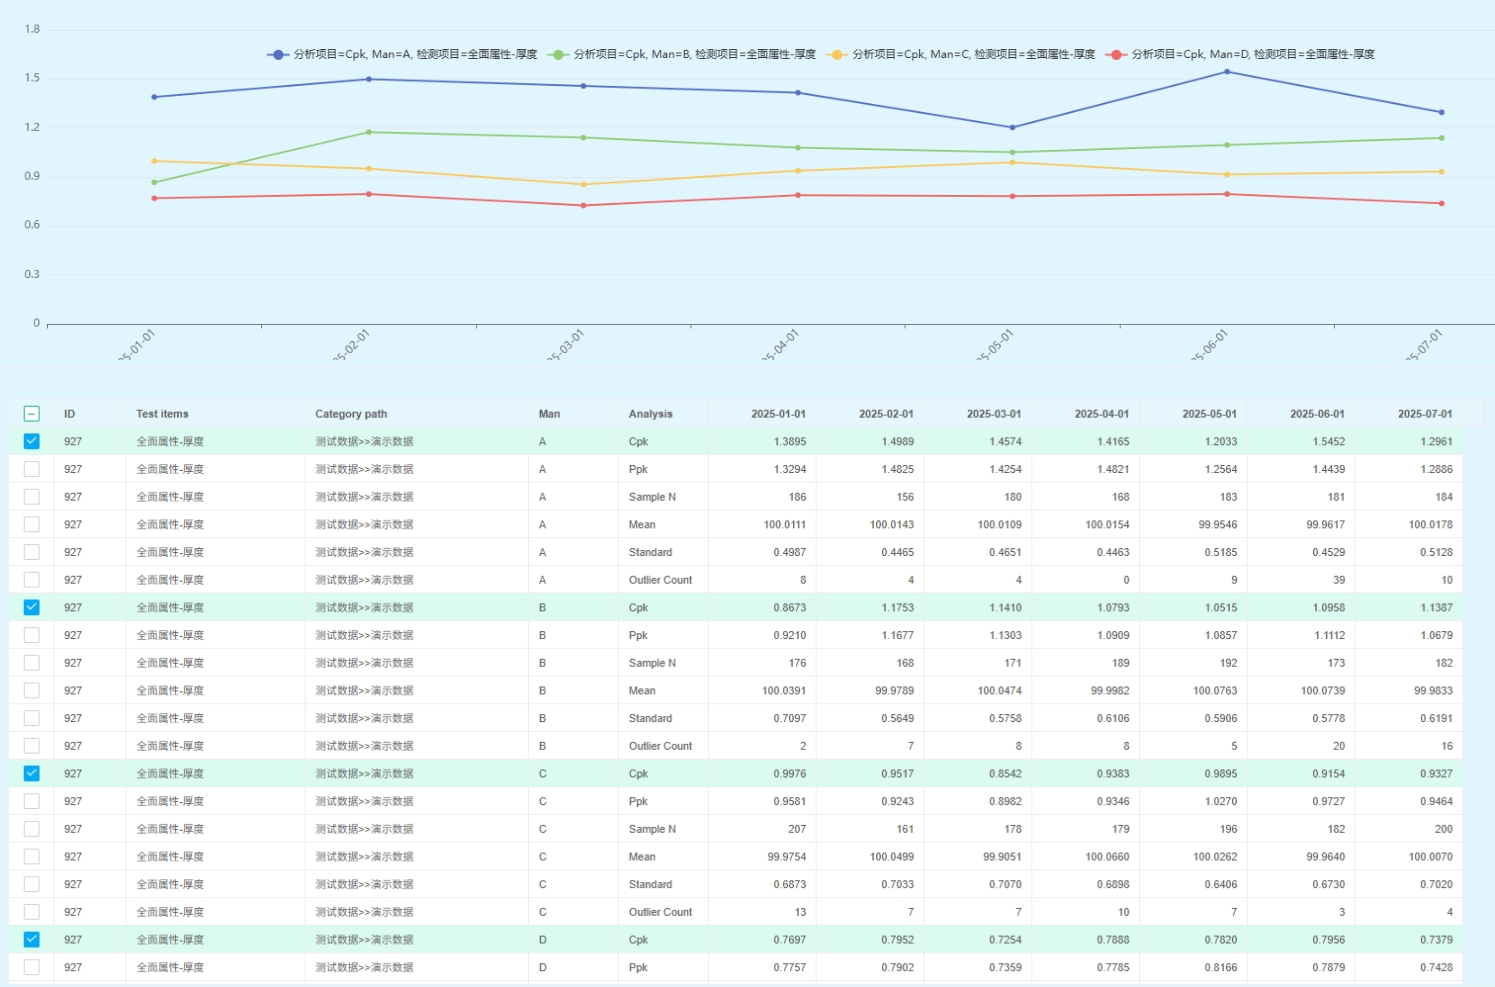
Analysis Conclusion:
The core factor affecting the overall CPK has been successfully identified — differences in operator standardization and execution.
The figure below shows the CPK trend charts of Teams A, B, C, and D.
3. Execution: From Quality Improvement to Intelligent Production Scheduling
After identifying the root cause, the ultimate goal of quality management is to create business value.
Especially in industries with extremely high quality requirements, such as automotive components and semiconductors, the conclusions derived from SPC analysis must be transformed into executable business actions.
Strategy 1: Quality Improvement
The high CPK performance of Team A proves that the current equipment and materials already have the physical capability to achieve high process capability.
In-Depth Benchmarking
Conduct on-site investigations into Team A’s best practices in operation methods, parameter fine-tuning, and inspection execution.
Standardization
Convert tacit experience into explicit SOPs (Standard Operating Procedures), and provide targeted training for underperforming teams to fundamentally reduce systematic variation caused by human operations.
Through these methods, the production capability of Teams B, C, and D can gradually improve, allowing their CPK performance to approach Team A and ultimately improve the overall CPK.
Strategy 2: Intelligent Order Routing
Improving operator skill levels takes time.
When facing urgent production tasks, enterprises can offset quality risks through a “dynamic order routing” strategy:
High-Priority / VIP Orders
Assign the most demanding orders to the best-performing Team A (or the optimal machine and supplier combination) to ensure delivery quality for key customers.
Regular Orders
Assign regular orders to teams still in the capability improvement phase, while increasing inspection frequency to control quality risks.
The examples above are only a starting point.
More dimensions can be analyzed and applied using the same methodology, depending on your enterprise’s data structure and application maturity.
You can also watch this practical demonstration video:
The Core Value of SPC
A low CPK is not an unsolvable problem.
As demonstrated in this practical case study, modern SPC is not merely a post-event warning tool based on control charts. It is also a powerful “microscope” for root cause analysis based on the 5M1E framework.
Through systematic stratified analysis, enterprises can upgrade quality management from simply “detecting defects” to becoming an intelligent engine that guides lean manufacturing and supports business decision-making.
Therefore, enterprises need:
- Complete inspection data with full 5M1E information
- A fast and efficient SPC analysis tool
Only then can the true value of SPC be realized.
If you would like to learn more, please feel free to contact us.