


When customers come for a factory audit and see Cpk reports all above 1.33, everyone is happy. But step onto the shop floor, and you still see piles of scrap. Many immediately scold: "These guys are just making up data in the office again; they have absolutely no bottom line!"
But blaming the frontline workers is a bit unfair. Often, this "data beautification" isn't a character issue; it is a desperate response forced by unreasonable technical demands.
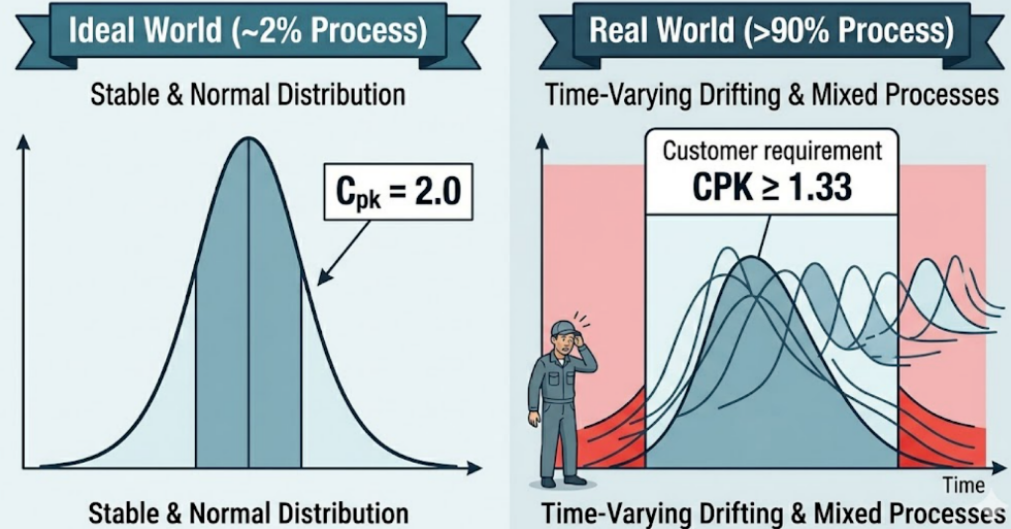
First, calculating Cpk has a rigid prerequisite: the process must be stable, and the data must follow a normal distribution.
But look at a real workshop: tool wear, equipment aging, room temperature changes—which of these doesn't affect the process? Processes that strictly meet this ideal "stable and normal" state probably account for less than 2%. The remaining 90%+ are mixed processes that drift and fluctuate over time.
Naturally, these unstable processes score poorly when calculated using standard Cpk formulas, yet customers demand a Cpk > 1.33. The production line simply cannot achieve this, but the audit must be passed. Aside from "tweaking" the data, what else can they do?
Second, everyone assumes ugly data means a poor production line, but often, it's the measurement instruments holding things back.
The Cpk you see includes both the true variation of the part and the error of the measurement system. Often, the actual machining capability of the process is perfectly fine, but insufficient gauge precision amplifies the variation, dragging the calculated data abruptly below the passing line. Auditors bite down on the 1.33 requirement and won't let go. Unable to defend themselves, workers have to tamper with the reports just to get by.
Even more outrageous is the misapplication of metrics.
Cpk evaluates the "potential capability" of a process after it has stabilized, whereas Ppk looks at the actual performance, including long-term variations. For many new products during the ramp-up phase, or processes inherently in a state of fluctuation, Ppk is the metric that should be reviewed. But the current bizarre phenomenon in audits is: regardless of the context, auditors only recognize Cpk ≥ 1.33.
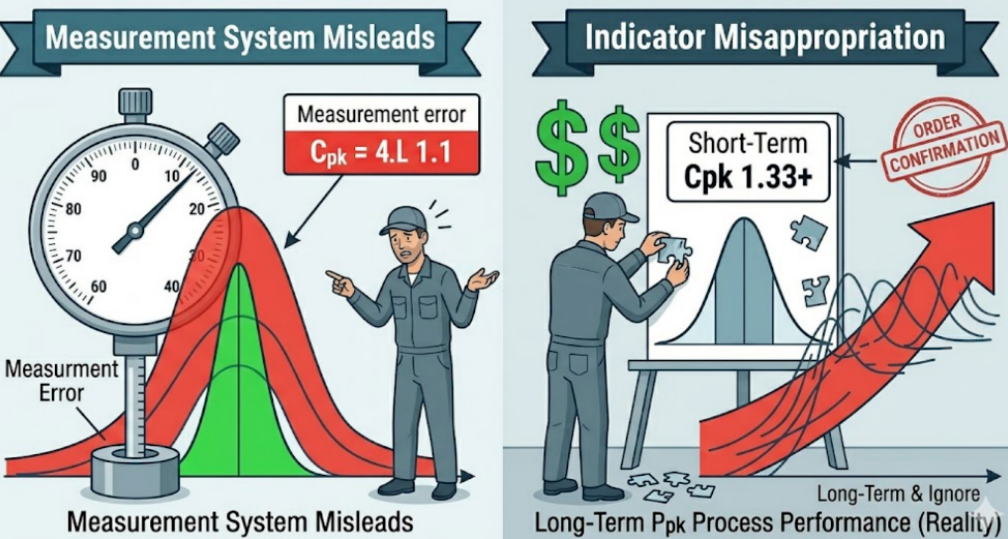
To cater to this rigid rule, people are forced to deliberately cherry-pick a short-term, good-looking dataset to make up the numbers. This isn't quality control; this is just to pass an audit.
When a dry number directly determines orders and bonuses, and the set standards are completely unrealistic, faking it becomes a survival instinct.
The distortion of Cpk data is fundamentally rooted in erroneous statistical premises compounded by rigid metric audits. If this evaluation logic isn't changed, you won't eliminate faking; you will only make the fakers more professional.
Allowing data to "look bad" and directly facing true production line fluctuations is the real hallmark of quality management.
To bid farewell to this internal friction of exhaustingly "faking" data just to cope with audits, enterprises need a system that truly understands the industrial shop floor. NEXSPC 4.0 software completely cuts off the backdoor of manual "data cherry-picking" through automated data acquisition. It provides powerful dashboards and alarm functions, instantly notifying you when anomalies occur. Rather than racking your brains to "beautify" reports, use a genuine digital closed loop to win the long-term trust of your customers.