


NEXSPC (formerly Simple SPC) is a privately deployed, browser-based WEB SPC software solution.
No installation is required — simply access the system through a web browser.
For three consecutive years, NEXSPC has been recognized by SoftHome as a recommended SPC software solution.

1. WEB-Based Architecture
- Deployed on enterprise intranet servers with secure and controllable data
- Browser-based access with no client installation required
- Server-based licensing with one-time lifetime authorization and no annual fees
- Unlimited users, unlimited concurrent online users, unlimited points (characteristics / inspection items), and unlimited dashboards
- Supports SPC control charts: I-MR, Xbar-S, Xbar-R, MR-R/S, NP, C, P, U
- Supports 11 languages, making it one of the most multilingual SPC software solutions globally, including:
- English
- Simplified Chinese
- Traditional Chinese
- Spanish
- Japanese
- Korean
- Vietnamese
- Indonesian
- Hindi
- Thai
- Malay
Everyone within the company can use the system.

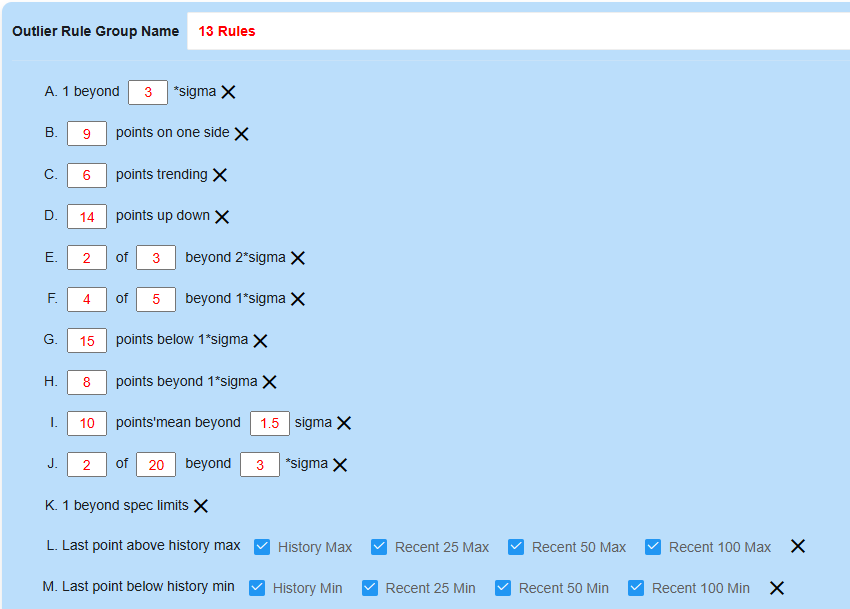
2. SPC Rule Group Management
- Different inspection items can use different SPC rule groups
- Supports 13 SPC rule violation rules, including the standard 8 SPC rules
- Rule parameters are fully configurable
- Supports grouped rule management
- Different SPC rule groups can be assigned to different inspection items
- Newly added historical extreme value detection across multiple stages
Related Article:
SPC Out-of-Control Rules Explained:How to Achieve More Accurate Process Alerts ( NEXSPC Practical Guide)
3. Real-Time Dynamic SPC Control Charts
When data is updated, control charts refresh automatically without requiring browser refresh.
Related Article:
SPC Dashboard: Building the Real-Time Monitoring Hub for Smart Factories

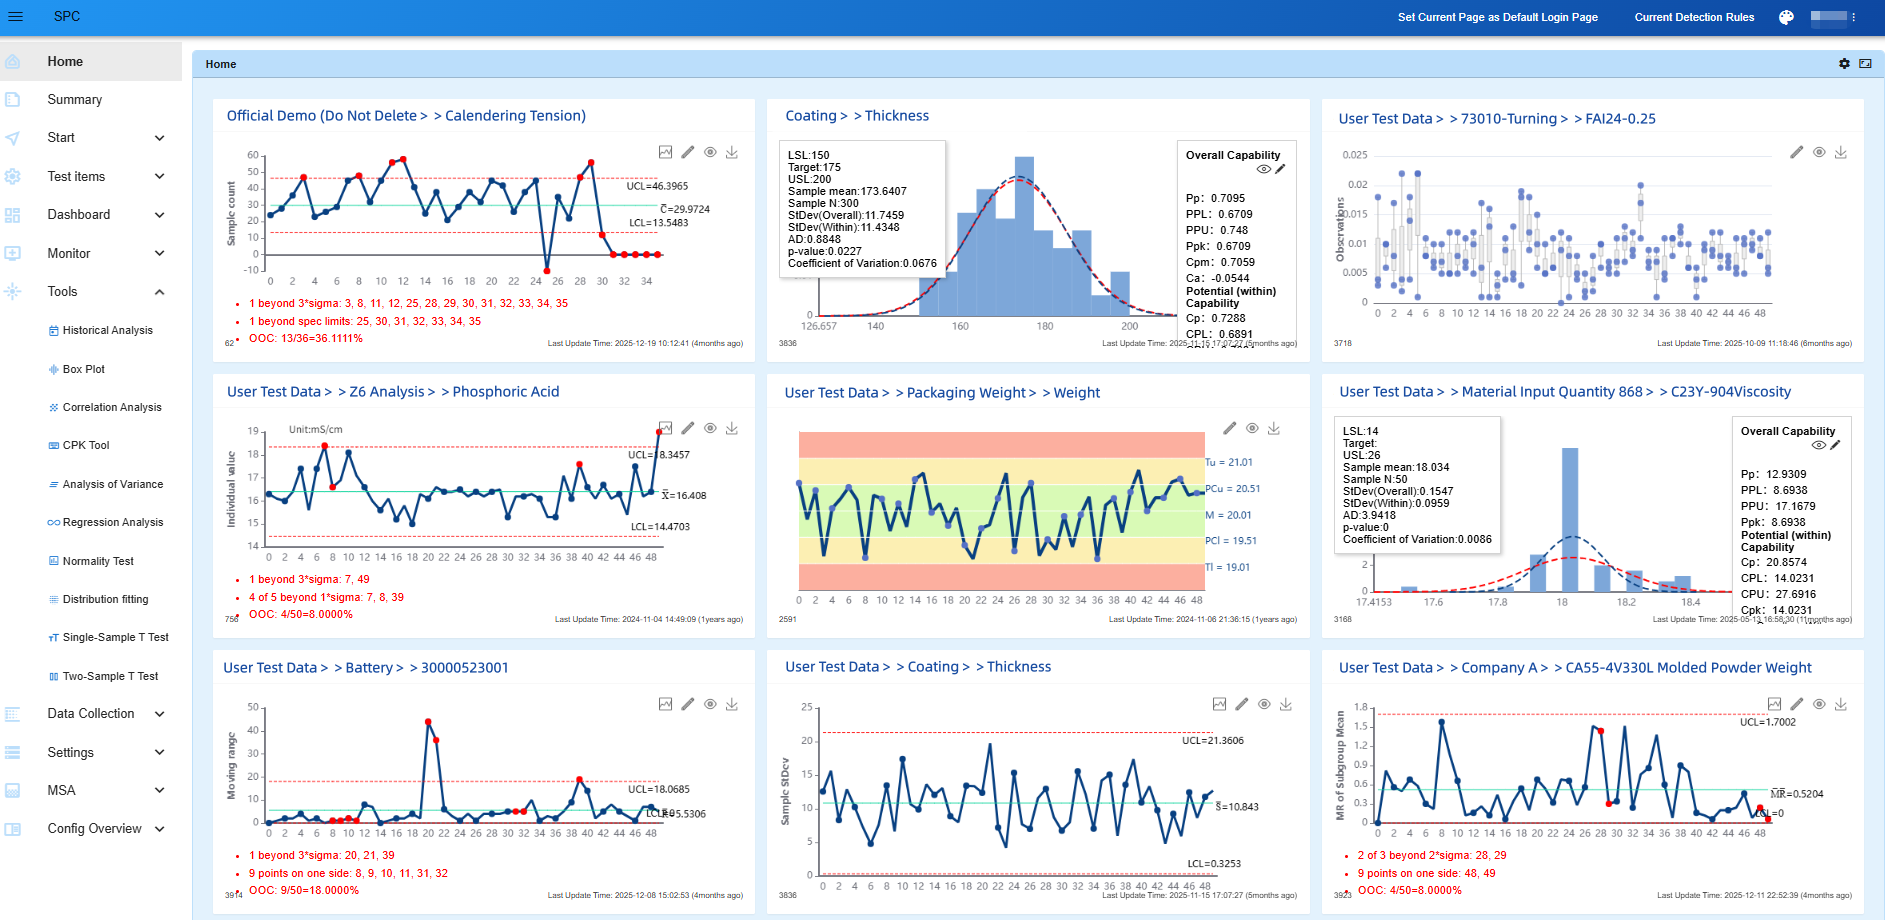
4. Inspection Items
After fully automated quality data collection is established, all inspection data is stored within the SPC system.
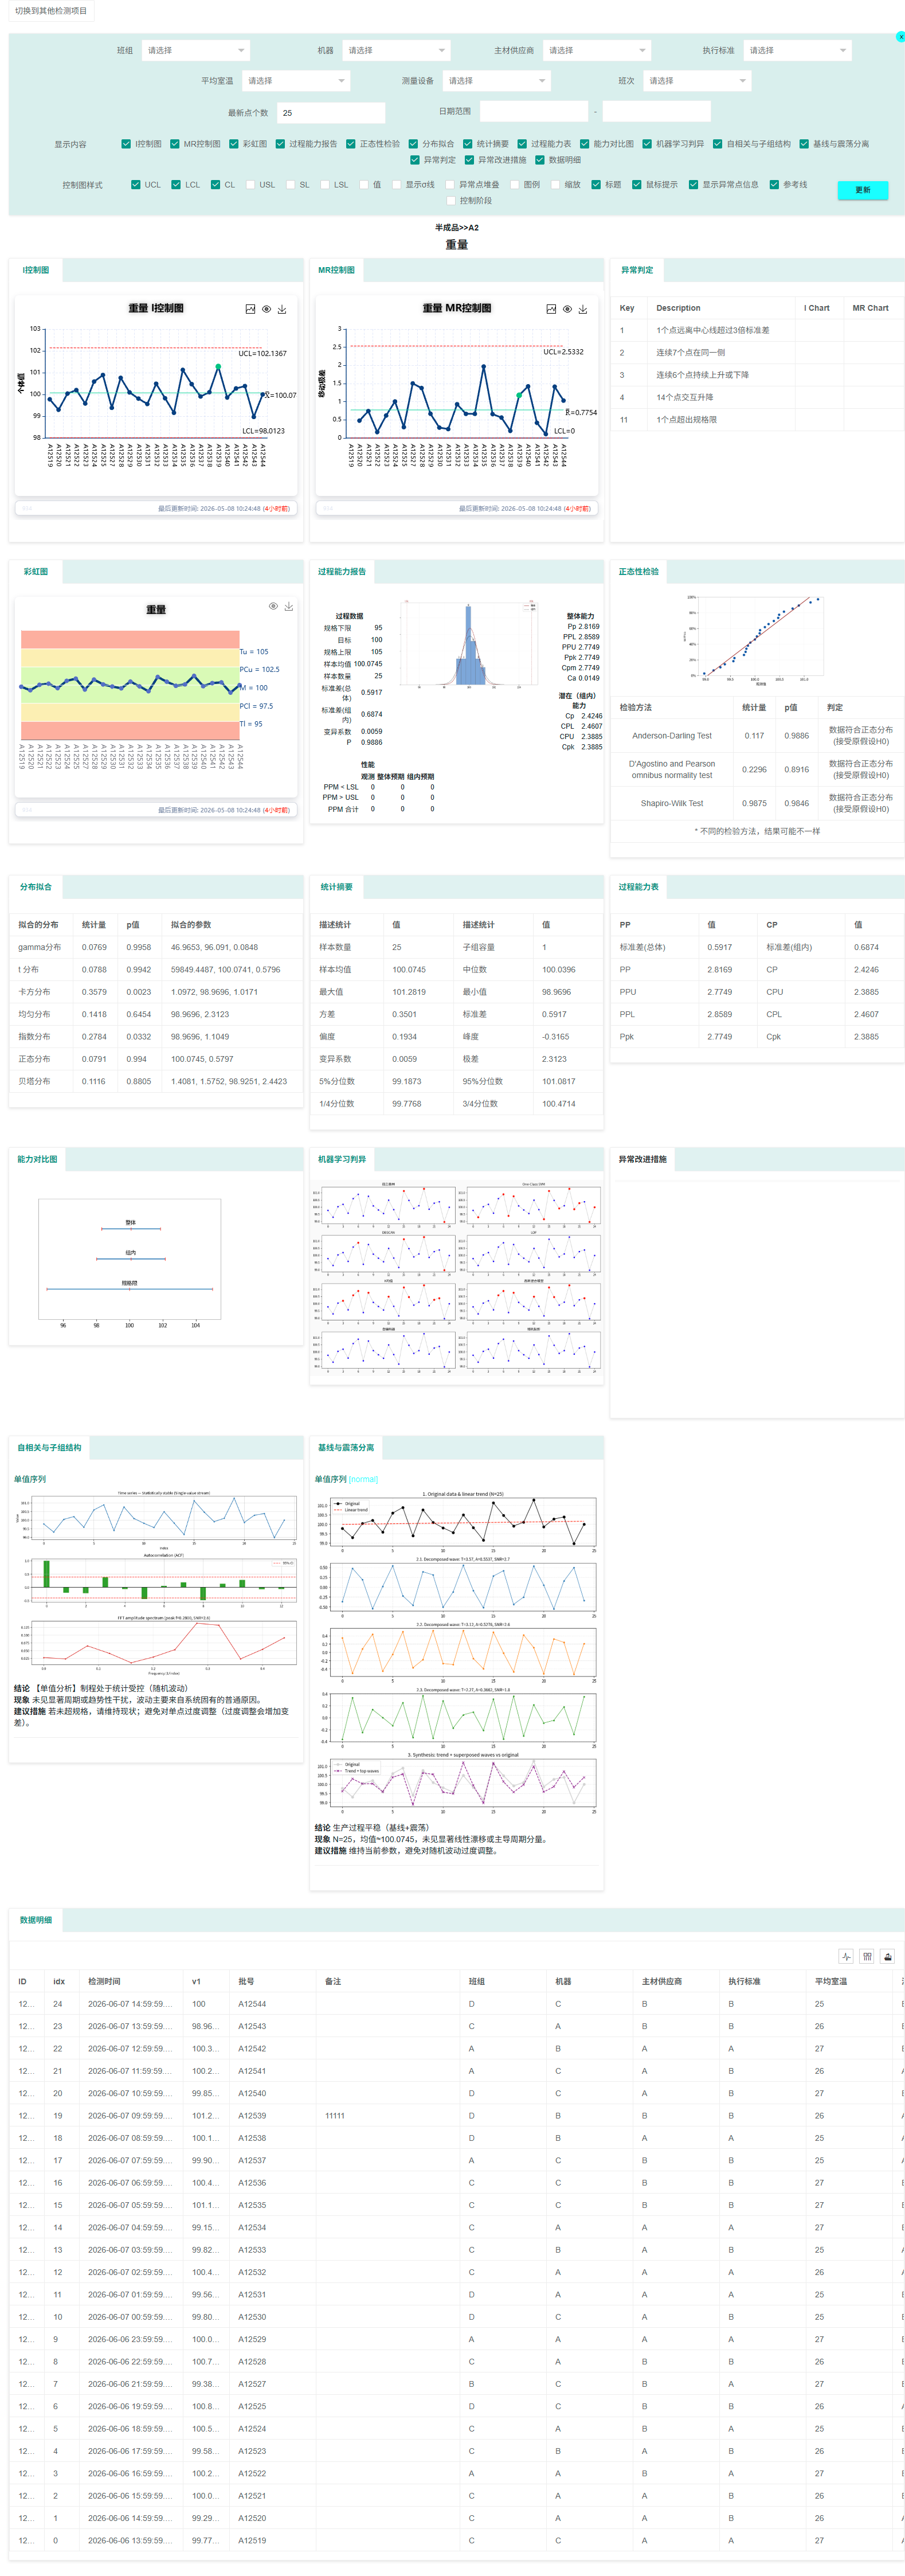
For every inspection item, users can generate a complete SPC analysis report with a single click.
The report includes:
- Appropriate control charts and subgroup distribution charts
- Process capability reports (including PPK, CPK, PPM, histograms, and fitted curves)
- Normal probability plots and capability comparison charts
- Normality tests and distribution fitting analysis
- Machine learning abnormality detection charts
- Statistical summary tables and process capability tables
- Data details and rainbow charts
- Historical abnormalities and corrective actions
4.1 Supported SPC Analysis Types
Variable Data
- IMR Control Charts
Fixed Subgroup Data
- Xbar Control Charts
- R Control Charts
- S Control Charts
- MR-RS Control Charts
- Xbar Moving Range Control Charts
Variable Subgroup Size
- Xbar Control Charts
- R Control Charts
- S Control Charts
Attribute / Count Data
- NP Control Charts
- C Control Charts
- P Control Charts
- U Control Charts
Record-Type Data
- Descriptive inspection items (record-only)
4.2 One-Click Comprehensive SPC Analysis Reports
4.3 Corrective Action Support
Users can conveniently review historical alarms and corresponding corrective actions for each inspection item.
The control chart comment section in SPC analysis reports supports file attachment uploads.
After abnormal red points are processed, they automatically change into green points, making the handling process more visual and traceable.
4.4 Historical Alarm Records
4.5 Inspection Item Comparison
Users can select and compare multiple inspection items.
4.6 Batch Export of SPC Analysis Reports
Multiple inspection items can be selected and exported to Excel in batches.
4.7 Large Language Model Integration
Supports integration with both public and private AI large language models, including private DeepSeek deployment.
5. SPC Dashboards
As manufacturing becomes increasingly digitalized, workshop dashboards are widely used to monitor production processes, order progress, and workstation loads.
SPC quality dashboards follow the same visualization trend by enabling real-time quality monitoring at every production stage requiring SPC control.
- Create unlimited dashboards
- Add unlimited control charts to each page
- Each page has an independent URL for workshop display screens
- Supports:
- SPC control charts
- Pre-control charts (rainbow charts)
- Capability analysis histograms
- All charts update dynamically in real time
- Supports private dashboard categorization and management
- Dashboard categories and chart layouts support drag-and-drop arrangement
5.1 Dynamic Dashboards
Dynamic dashboards can automatically display inspection items from selected categories whenever data updates occur.
5.2 Comprehensive Dashboards
5.3 Statistical Dashboards and Custom Charts
6. SPC Monitoring
6.1 Monitoring Configuration
Abnormal inspection item notifications now support different notification groups for different inspection item categories.
6.2 Alarm Rules
6.3 Abnormality Lists
6.4 Email Notifications
6.5 OA or other Notifications
7. Data Collection
7.1 Manual Entry
Inspection data can be manually entered with real-time SPC control chart updates.
7.2 Multi-Item Entry
Multiple inspection items — even of different types — can be entered simultaneously.
7.3 Excel Batch Upload
Inspection data can be uploaded in batches using predefined Excel templates.
7.4 Mobile Data Entry
7.5 MQTT Data Collection
Supports real-time data collection from inspection equipment and production equipment using MQTT protocol.
7.6 HTTP Interface Synchronization
If inspection data already exists in another business system, it can be synchronized through HTTP APIs without re-entry.
7.7 Active JSON Data Collection
7.8 SAP Inspection Plan Synchronization
8. Powerful Analysis Tools
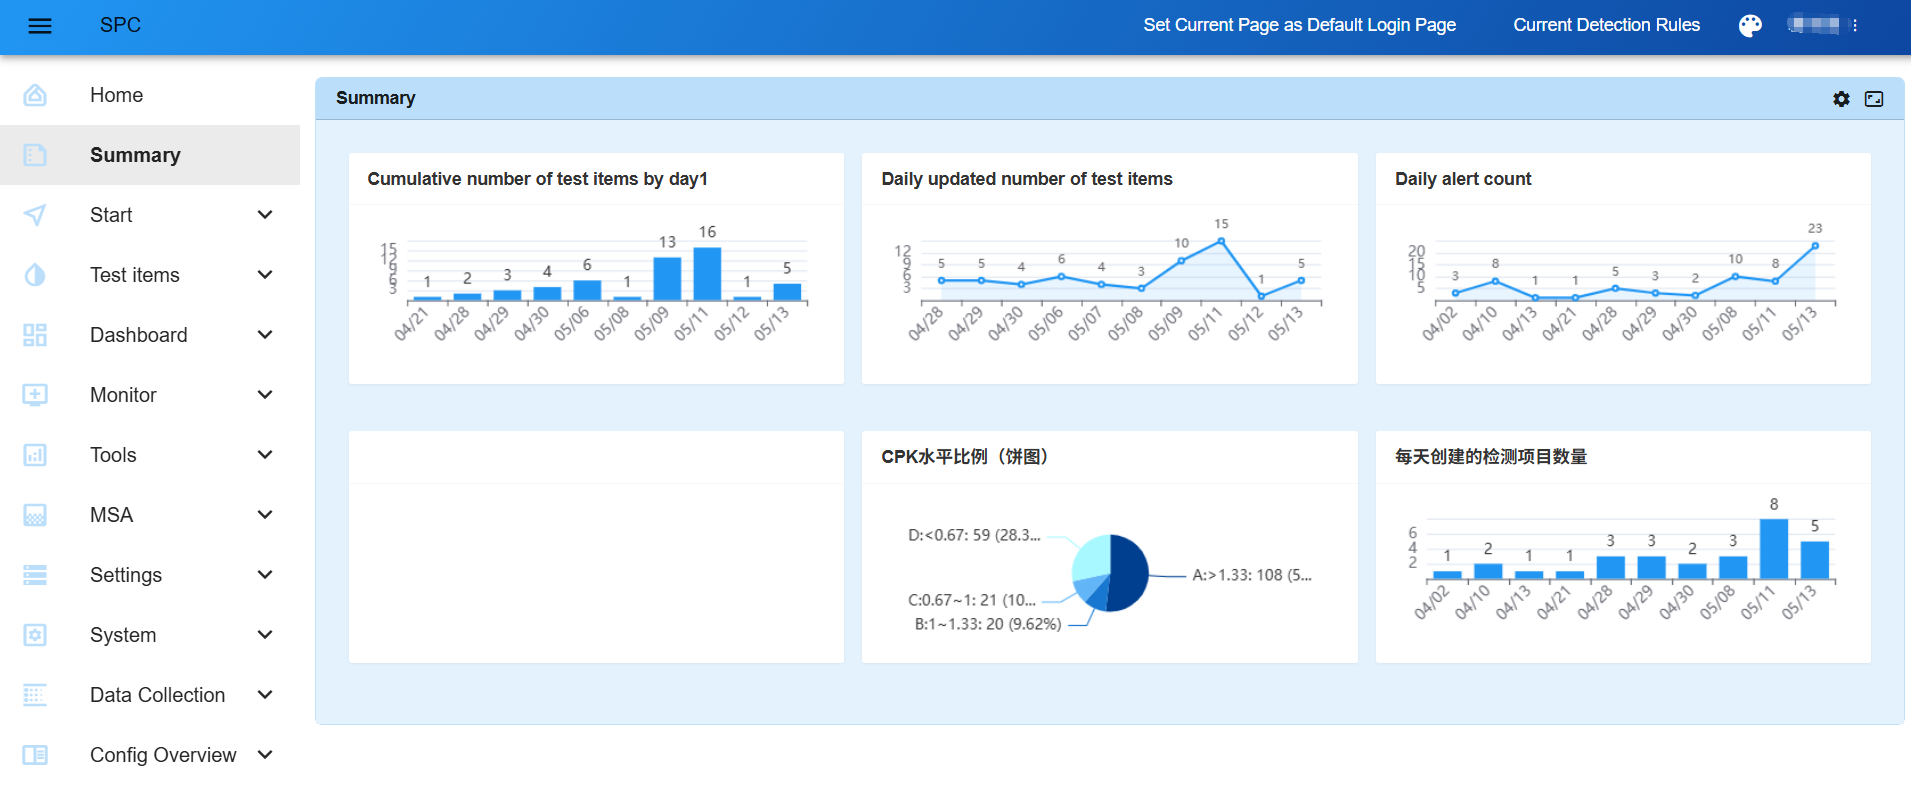
8.1 SPC Historical Analysis
SPC historical analysis enables periodic statistical analysis and comparison of inspection items.
Features include:
- Specify analysis start and end dates
- Statistical dimensions:
- Quarterly
- Monthly
- Weekly
- Daily
- Select statistical indicators such as:
- Cpk
- Number of abnormal points
- Multiple inspection items can be analyzed simultaneously
- Results can be visualized or exported
8.2 Box Plot Analysis
For variable-type inspection data, box plots can be generated based on fixed time intervals.
8.3 Correlation Analysis
SPC systems contain large amounts of inspection data, and some inspection items may share correlations.
Traditionally, engineers export data into Excel or Minitab for regression and correlation analysis.
NEXSPCprovides a far more efficient method:
- Perform scatter plot and regression analysis across multiple inspection items
- Align inspection dates using different methods
- Lag periods can be configured as ranges instead of testing individually
- Complete analysis directly inside one system without exporting data
- Automatically identify correlated inspection items across:
- N inspection items
- M lag periods
8.4 CPK Tool
Users can directly perform SPC control chart analysis and CPK analysis without creating inspection items or synchronizing data.
Features include:
- Supports variable data and subgroup SPC analysis
- Supports Excel copy-paste data analysis
- Replaces Minitab-style control chart and capability analysis functions
New Features
- Non-normal distribution analysis support (Box-Cox transformation)
- SPC analysis support for variable subgroup sizes
- Full support for one-sided specification limits across:
- Monitoring modules
- Control charts
- SPC rule violation rules
8.5 Regression Analysis
Also includes:
- ANOVA
- Normality Tests
- Distribution Fitting
- One-Sample T-Test
- Two-Sample T-Test
9. MSA Support
Gauge Linearity and Bias Study
Gauge R&R Study (Nested)
Gauge R&R Study (Crossed)
Attribute Agreement Analysis
10. Case Studies
10.1 Mettler Weighing System
A weighing device sends weight data through TCP SERVER communication.
A lightweight TCP CLIENT application captures the data and synchronizes it into the SPC system for real-time analysis.
10.2 Bluetooth Micrometer
10.3 Quality-Oriented Production Scheduling
For the same product and critical inspection item, quality data can be stratified by different sources such as:
- Machine A / Machine B
- Shifts
- Production lines
- Operators
This allows enterprises to identify CPK differences between sources and allocate important customer orders to higher-CPK production resources.
10.4 Active DCS Database Collection
Large amounts of production data already stored in data centers can be synchronized directly into the SPC system through direct database connections.
11. Additional Features
11.1 Integration with Other Business Systems
Supports integration into other web systems through:
- SSO
- Token-based URL access
11.2 Multi-Language Support
Supports 11 languages:
- English
- Simplified Chinese
- Traditional Chinese
- Thai
- Japanese
- Vietnamese
- Korean
- Indonesian
- Spanish
- Hindi
- Malay
11.3 20 UI Themes
12 Other Features
- Unlimited users, unlimited points, unlimited dashboards
- Supports alarm notifications through:
- APIs
- WeCom
- DingTalk
- Open SPC rule detection APIs and system data interfaces
- Custom SPC report styles
- Style groups can be applied to different inspection item types
- Custom alarm notification recipients
- Visitor Mode
After enabling Visitor Mode:
- No abnormal inspection items are displayed
- No abnormal points appear on control charts
- Ideal for customer visits and demonstrations
Related Article:
What Is Visitor Mode? A Smart Visualization Tool That Helps Customers See Value
Additional Features:
- User-defined SPC rule violation rules
- Custom fields and custom input fields
- Personalized homepage
- Fine-grained user permission management with:
- Menu permissions
- Data permissions
- Detailed administrator role control