


On the production floor, SPC control chart data fluctuates wildly:
“Is this caused by tool wear, or is the fixture becoming loose?”
Traditional SPC systems can often tell engineers only one thing:
“Something is wrong.”
But they cannot clearly identify:
“What exactly should be repaired?”
The new Baseline and Oscillation Separation Diagnostic technology in NEXSPC acts like a “CT scan” for manufacturing processes — precisely uncovering the true root causes hidden behind complex process fluctuations.
1. Manufacturing Pain Point: Confused Trends and Oscillations
In real SPC applications, engineers frequently encounter situations like this:
- SPC control charts continuously trigger alarms
- Data shows severe sawtooth-style fluctuation
- The process mean also appears to be drifting upward
When these abnormalities become mixed together, traditional SPC Western Electric Rules often become ineffective or generate ambiguous warnings.
To stabilize dimensions, operators may repeatedly adjust machine parameters based only on the latest few data points.
Unfortunately, this often creates a bigger problem:
Natural process variation is mistaken for special-cause variation.
Instead of reducing variation, the process becomes even more unstable.
The Core Problem: Traditional SPC Cannot “Decouple” Complex Variations
In complex manufacturing environments, one chaotic SPC control chart may actually be generated by multiple independent physical behaviors simultaneously.
For example:
Baseline Drift
Slow, long-term directional movement caused by:
- Tool or grinding wheel wear
- Thermal deformation from temperature changes
- Cutting fluid concentration decay
High-Frequency Oscillation
Short-cycle repetitive fluctuations caused by:
- Multi-cavity mold variation
- Fixture eccentricity
- Rotating equipment vibration
- Mechanical resonance
If these different behaviors cannot be separated, true root cause analysis becomes nearly impossible.
2. The Breakthrough Technology: What Is Baseline and Oscillation Separation?
To solve this manufacturing challenge, NEXSPC introduces:
Baseline and Oscillation Separation Diagnostics.
This technology combines:
- Regression analysis
- Fast Fourier Transform (FFT) signal processing
to perform a deep “digital CT scan” on industrial process data.
Step 1: Trend Extraction — Identifying Macro Drift
The algorithm first extracts the dominant trend line across the entire sampling window.
Like a precision razor, it removes the slowly changing baseline trend from chaotic process data.
Business Value
Even if process data appears highly unstable, the system can still determine:
“The process center has not shifted — do not adjust machine compensation.”
Conversely, if real drift exists, the system can accurately estimate total drift magnitude and trigger early tool-life warnings.
Step 2: Waveform Decomposition — Capturing Micro Oscillations
After removing the macro trend, the remaining residual signal contains only the process fluctuations.
The system then uses FFT analysis to decompose these residuals into sinusoidal waveforms with specific physical frequencies and periods.
Business Value
The system no longer simply reports:
“Process out of control.”
Instead, it translates abnormality detection into actionable engineering guidance.
For example:
“Strong oscillation detected with period T = 4.”
This immediately points engineers toward:
- 4 rotating stations
- 4-cavity molds
- Cyclic mechanical structures
reducing troubleshooting scope dramatically.
3. Real Manufacturing Scenarios
Scenario A: Hidden Tool Wear
Long-Term Drift Detection
Traditional SPC Behavior
Data slowly drifts upward, but occasional lower values create the illusion that the process remains under control.
Eventually, large batches of out-of-spec products appear.
Baseline Separation Diagnostic Result
The algorithm filters out high-frequency measurement noise and accurately extracts the underlying drift trend.
Automatic System Report
Systematic long-term drift detected (total deviation: 0.05 mm).
Recommended Actions:
- Inspect continuous tool wear
- Schedule tool compensation
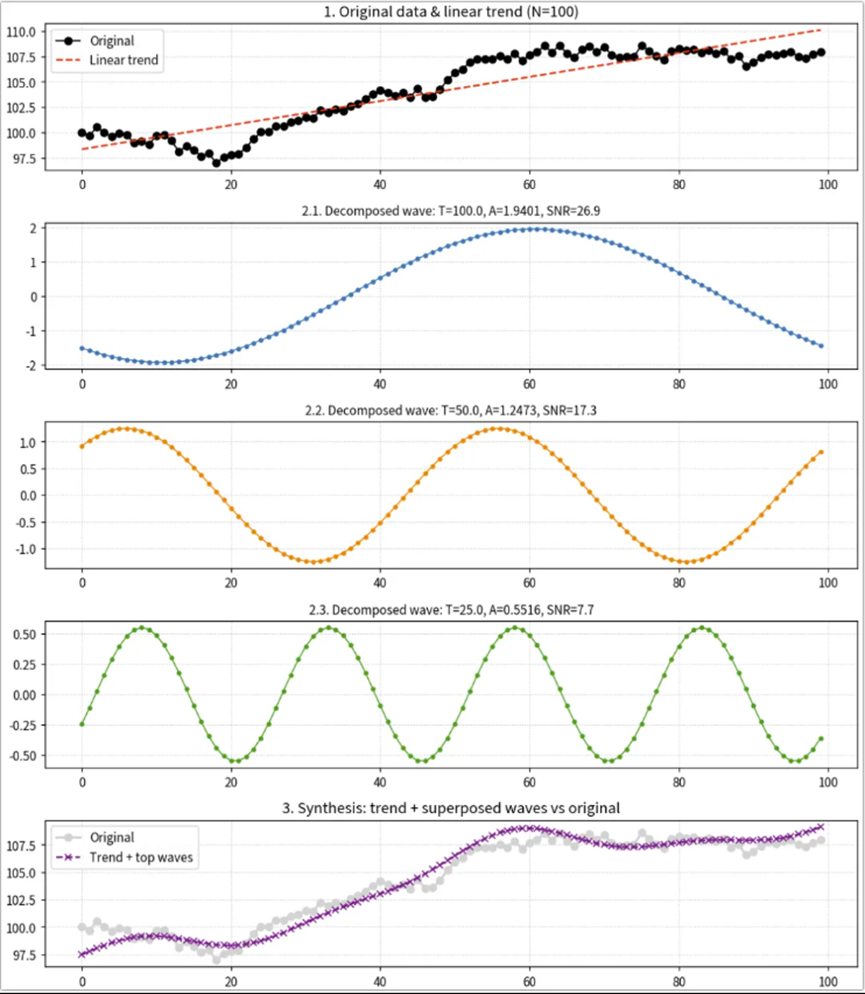
Example Conclusion
Composite Abnormality: Significant Drift with Strong Periodic Oscillation
Phenomenon:
Total linear drift approximately 11.8883 with dominant periodic cycle around 100 sampling intervals.
Recommended Actions:
Prioritize investigation of:
- Tool wear
- Environmental drift sources
- Mechanical or measurement factors associated with the dominant cycle
Scenario B: Multi-Station Equipment Consistency Failure
High-Frequency Oscillation Detection
Traditional SPC Behavior
Data alternates violently between high and low values.
The process average appears stable, but the range (R) becomes extremely large.
This is often misdiagnosed as:
- Material inconsistency
- Random instability
Baseline Separation Diagnostic Result
After removing trend components, FFT analysis identifies a dominant high signal-to-noise frequency band with a cycle of 2.0.
Automatic System Report
Abnormal high-frequency oscillation detected (Cycle T = 2.0).
Recommended Actions:
- Stop unnecessary machine adjustments
- Inspect:
- Dual-spindle or dual-cavity variation
- Electromagnetic interference
- Measurement system instability
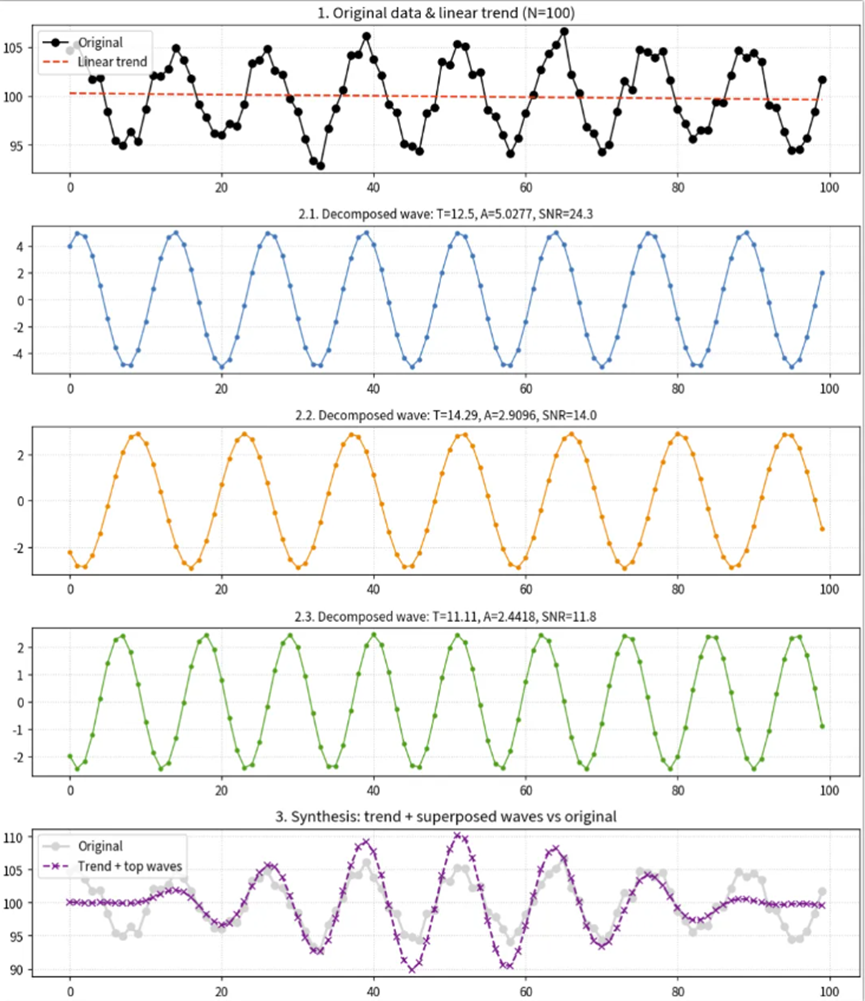
Example Conclusion
Periodic Oscillation Detected
Phenomenon:
Dominant periodic cycle approximately 12.5 sampling intervals with significant energy above background noise.
Recommended Actions:
Inspect:
- Related workstations
- Fixtures
- Rotating components
- Material batch cycles
Scenario C: Severe Composite Abnormalities
Drift + Oscillation Occurring Simultaneously
Traditional SPC Behavior
The control chart becomes completely chaotic.
Engineers struggle to identify the true root cause.
Baseline Separation Diagnostic Result
The algorithm successfully separates:
- An upward baseline drift
- A dominant oscillation period of 8
Automatic System Report
Composite abnormality detected: process center drifting upward while strong oscillation exists simultaneously.
Recommended Actions:
- Inspect tool wear
- Inspect fixture looseness on the 8-station rotary system
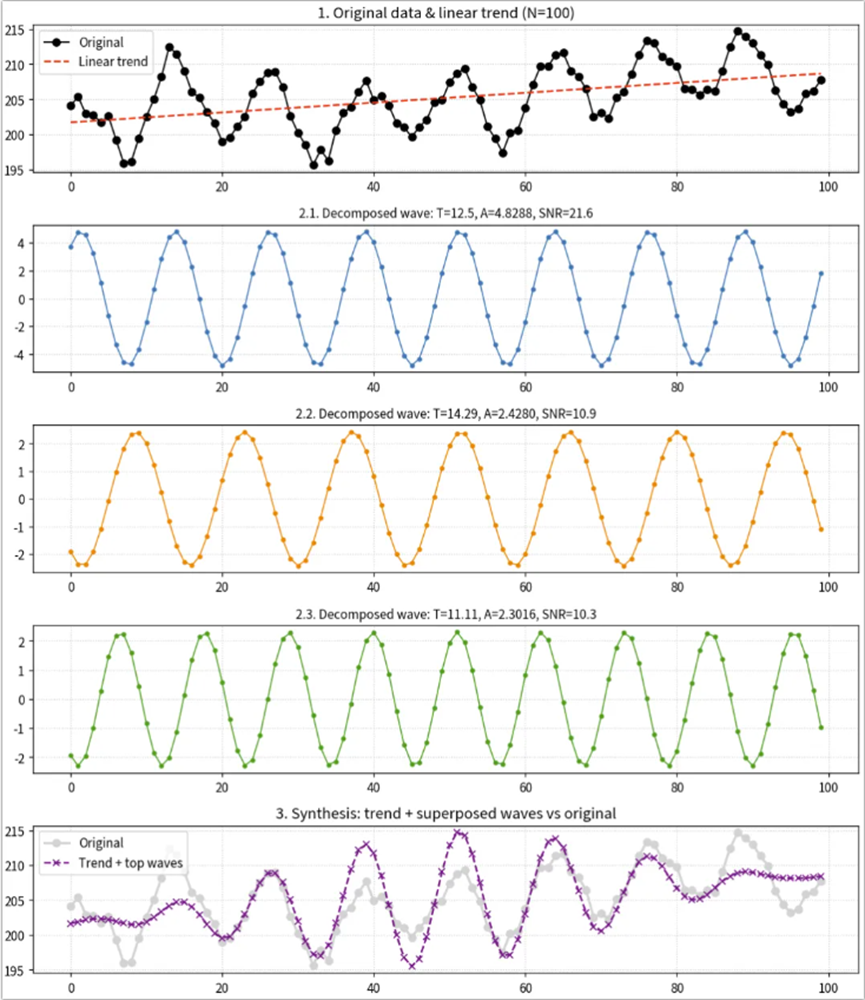
Example Conclusion
Composite Abnormality: Significant Drift with Strong Periodic Oscillation
Phenomenon:
Total linear drift approximately 7.0045 with dominant cycle around 12.5 sampling intervals.
Recommended Actions:
Prioritize investigation of:
- Macro drift sources
- Mechanical or measurement factors related to the dominant cycle
4. From “Data Visualization” to “AI Root Cause Intelligence”
Under Industry 4.0 and smart manufacturing trends, manufacturers no longer need SPC software that simply draws control charts.
Modern factories require:
Intelligent quality systems capable of understanding machine behavior.
The introduction of Baseline and Oscillation Separation Diagnostics marks an important evolution for NEXSPC:
From:
“Knowing that something happened”
To:
“Understanding why it happened”
Through rigorous mathematical decoupling and advanced signal analysis, NEXSPC helps manufacturers achieve:
- Reduced manufacturing costs
- Fewer defects and scrap
- Smarter root cause analysis
- Reduced unnecessary machine adjustments
- More stable production processes
This represents the next generation of intelligent SPC analysis for modern manufacturing quality management.