


When reviewing SPC systems in daily production, control charts often appear perfectly stable — not a single red point beyond the control limits. Yet at the end of the month, the Cpk suddenly drops without warning.
Or perhaps product dimensions show an unexplained “wave-like” fluctuation. Engineers bring reports to the production line to investigate, but still cannot identify the root cause.
Traditional SPC control charts and the “Western Electric Rules” are excellent at detecting sudden abnormal points. However, when it comes to uncovering hidden macro trends and micro rhythms buried inside large volumes of time-series data, they are often not enough.
To uncover these deeper process patterns, NEXSPC has introduced a major upgrade:
The new Autocorrelation Diagnostic feature.
This enhancement transforms complex time-series analysis techniques into intuitive, one-click diagnostic reports that quality engineers can easily understand and apply.
Why Traditional SPC Rules Are Sometimes Not Enough
Traditional SPC analysis works much like a “speed camera” — it focuses on identifying which data point violates a rule.
The new Autocorrelation Diagnostic function, however, acts more like an “ECG monitor” for the production line.
Instead of looking only at individual measurements, it analyzes the waveform and behavior of the entire time series.
Autocorrelation Analysis (ACF)
Autocorrelation analysis evaluates:
“How previous data influences future data.”
For example:
- If one product dimension is oversized,
- does the next product also tend to be oversized?
This helps identify hidden sequential dependencies within the process.
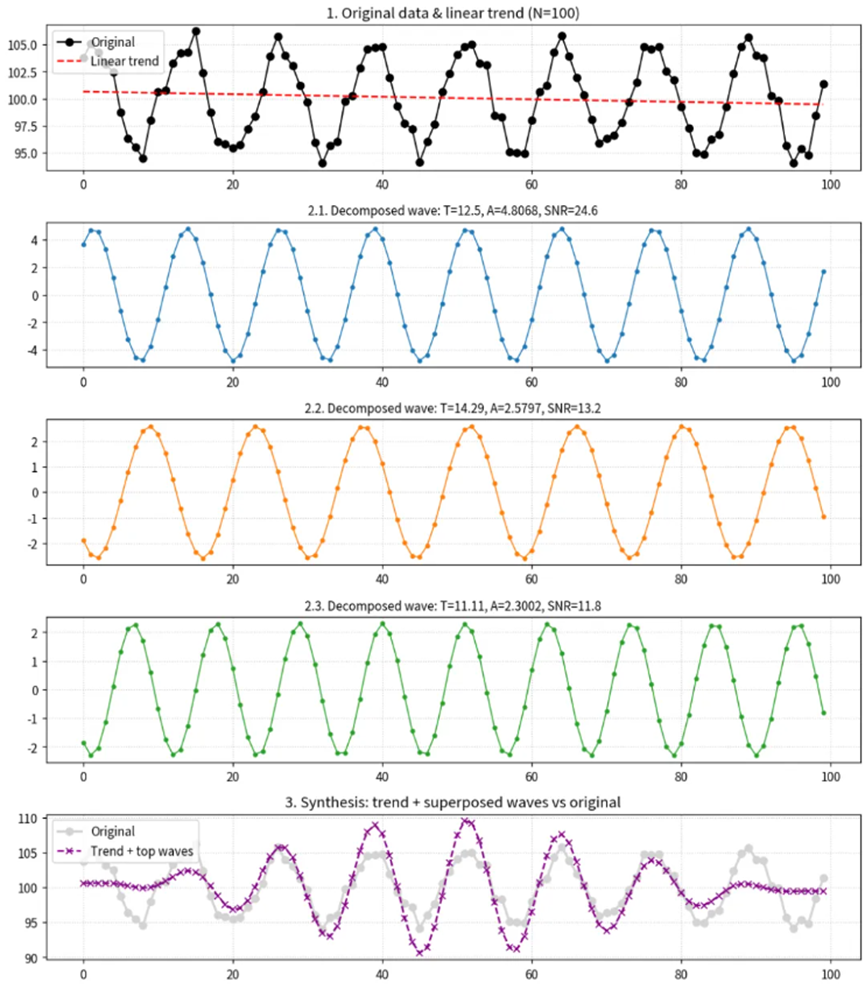
Frequency Spectrum Analysis (FFT)
Using Fourier Transform analysis, the system decomposes overlapping patterns hidden within noisy data.
This enables engineers to identify:
- Cyclic fluctuations
- Hidden periodic patterns
- Long-term oscillation behavior
that are difficult to detect using traditional SPC methods alone.
What Types of Hidden Manufacturing Problems Can It Detect?
With the new intelligent diagnostic engine, NEXSPC automatically scans production data and directly identifies the type of abnormal behavior occurring within the process.
1. Slow Drift
Early Warning for Tool Wear and Environmental Changes
In CNC machining or injection molding processes, gradual tool wear or slowly changing environmental temperatures can create dimensional drift that is almost impossible to detect visually.
Diagnostic Result
The system can identify these low-frequency long-term correlations and directly indicate:
“Slow drift trend detected.”
This allows engineers to proactively arrange:
- Tool compensation
- Equipment maintenance
- Environmental adjustments
before large quantities of defective products are produced.
Example Conclusion
[Individual Value Analysis] Slow Drift Trend Detected
Phenomenon:
Data shows a long-term unidirectional drift exceeding approximately 100 sampling intervals.
Recommended Actions:
Inspect:
- Tool or grinding wheel wear
- Gradual solution concentration changes
- Thermal deformation caused by environmental temperature
Compensation adjustments may be required.
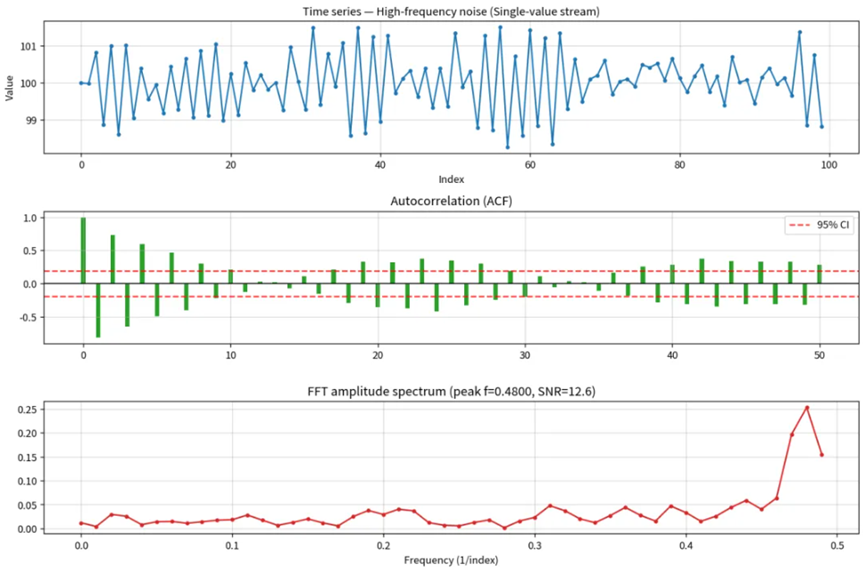
2. High-Frequency Oscillation and Measurement Noise
Identifying Equipment Resonance and Measurement System Problems
Sometimes process data fluctuates violently between adjacent samples, creating strong alternating high-low patterns.
In many cases, this is not caused by the manufacturing process itself.
Diagnostic Result
When extremely high-frequency oscillation is detected, the system intelligently recommends:
“Do not adjust the machine immediately. First inspect the measurement system.”

Potential causes may include:
- Mechanical resonance
- Electromagnetic interference
- Sensor instability
- Improper sampling frequency
- Measurement system variation
The system may also recommend performing a new MSA (Measurement System Analysis).
Example Conclusion
[Individual Value Analysis] Extreme High-Frequency Oscillation Detected
Phenomenon:
Adjacent data points alternate randomly and violently, commonly associated with measurement noise or interference.
Recommended Actions:
Inspect:
- GR&R performance
- Electromagnetic interference
- Sampling frequency settings
The measurement system should be prioritized for investigation.
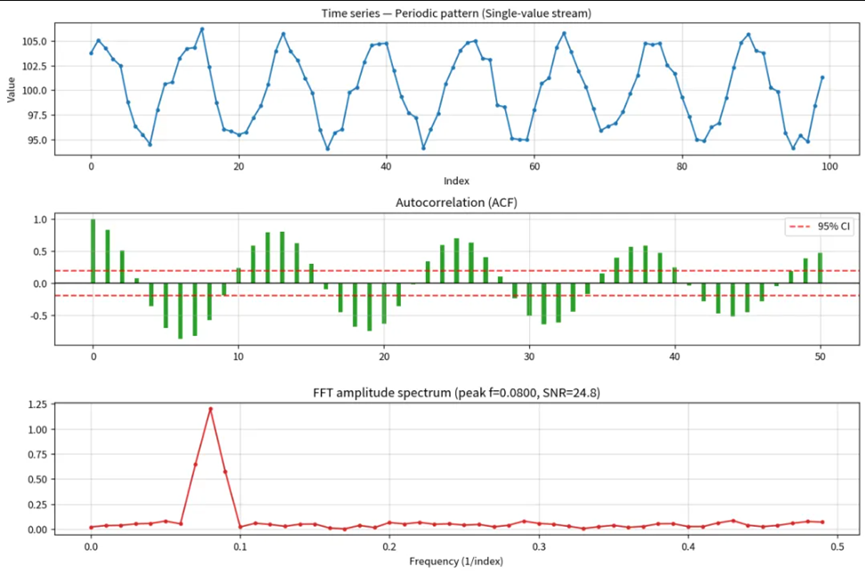
3. Periodic Patterns
Discovering Hidden Cycles in Multi-Axis Equipment and Shift Operations
Does the process repeatedly show peaks every few data points?
Possible causes include:
- Multi-axis spindle variation
- Fixture eccentricity
- Rotating component imbalance
- Different operator habits between shifts
Diagnostic Result
Frequency spectrum analysis can identify these periodic patterns and calculate the exact cycle length.
For example:
“A periodic fluctuation occurs every 8 products.”
With this information, engineers can immediately investigate:
- 8-cavity molds
- Rotational mechanisms
- Cyclic production stages
greatly improving troubleshooting efficiency.
Example Conclusion
[Individual Value Analysis] Periodic Component Detected
Phenomenon:
Data exhibits recurring fluctuation approximately every 12.5 sampling intervals.
Recommended Actions:
Inspect for:
- Workstations associated with the detected cycle
- Fixtures
- Rotating components
- Mechanical eccentricity
4. Near-Zero Variance (“Dead Water” Data)
Preventing False Data and Sensor Lockups
If process data becomes abnormally stable — with almost no natural fluctuation — this can actually indicate a serious problem.
Diagnostic Result
The system identifies these constant-value sequences and warns that the issue may involve:
- Artificially entered false data
- Insufficient measurement resolution
- Frozen sensors
- Malfunctioning instruments
Designed for Practical Manufacturing Use
We believe professional quality tools should remain easy to use.
With NEXSPC Autocorrelation Diagnostics:
- No advanced data science knowledge is required
- No complicated parameter configuration is needed
- Engineers can enable diagnostics with one click
Simply check the “Autocorrelation Diagnostic” option within the inspection item page.
The system automatically generates:
- Original waveform charts
- Autocorrelation plots
- Frequency spectrum analysis charts
Easy-to-Understand Multi-Language Reports
Even if users are unfamiliar with advanced statistical charts, the system directly outputs readable reports containing:
- Analysis conclusions
- Phenomenon descriptions
- Recommended improvement actions
NEXSPC supports 11 languages including:
- English
- Chinese
- Japanese
- Korean
making it suitable for multinational manufacturing environments.
Multi-Dimensional Process Analysis
For subgroup-based SPC data (such as Xbar charts with subgroup sampling), the system performs both:
- Mean trend analysis
- Subgroup variation analysis
This allows comprehensive monitoring of both:
- Macro process behavior
- Internal subgroup dispersion
without blind spots.
Ready-to-Use Diagnostic Reports
All diagnostic charts can be exported as high-resolution PNG images.
These reports are ideal for:
- 8D reports
- Customer audits
- Internal quality improvement presentations
- Process troubleshooting documentation

Bringing Quality Management Beyond Traditional Control Charts
As manufacturing becomes increasingly competitive, companies that extract deeper value from process data gain a major advantage in reducing true manufacturing costs.
NEXSPC not only supports:
- MQTT
- OPC
- Automated industrial data collection
but also focuses on delivering:
Advanced analytical capabilities beyond traditional SPC control charts.
The new Autocorrelation Diagnostic feature acts as a next-generation “magnifying glass” for quality engineers — helping uncover hidden process patterns and move toward predictive quality management.
If you would like to discover what hidden patterns exist inside your factory data, feel free to contact us for a free Bingo SPC system demonstration and give your production line a deeper “ECG-style” quality inspection.