


From Statistical Theory to Practical Applications in NexSPC
In SPC (Statistical Process Control), Process Capability Analysis (Cpk), and modern quality management, Normal Distribution is one of the most fundamental statistical concepts.
Whether you're working with:
- Control Charts
- Process Capability Analysis
- SPC Detection Rules
- Defect Rate Estimation
many of the most widely used statistical models are built upon the assumption of normal distribution.
Every day, manufacturers rely on:
- Cpk Analysis
- SPC Control Charts
- SPC Alerts
- Process Capability Studies
Yet many quality professionals have never fully explored a critical question:
Why does SPC depend so heavily on normal distribution?
And perhaps more importantly:
Why do most traditional Cpk calculations assume that process data follows a normal distribution?
The answer directly impacts the accuracy and reliability of your statistical conclusions.
What Is a Normal Distribution?
A Normal Distribution is the most common and widely recognized continuous probability distribution in statistics.
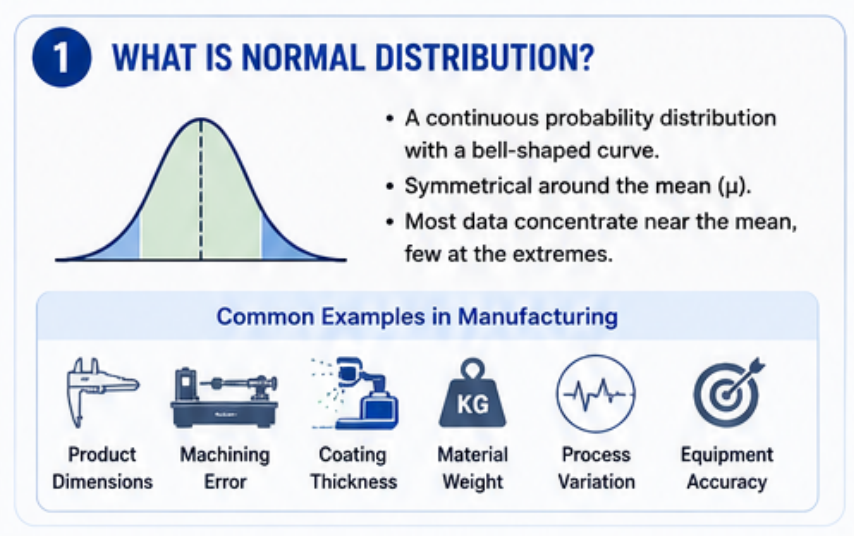
Its defining characteristics are:
- Highest frequency around the center
- Lower frequencies toward both ends
- Perfect symmetry around the mean
The resulting shape is commonly known as the Bell Curve.
In manufacturing environments, many quality characteristics naturally tend to follow a normal distribution, including:
- Product dimensions
- Machining errors
- Coating thickness
- Material weight
- Equipment accuracy
- Process variation data
Although these measurements are influenced by many different factors, when the sample size becomes sufficiently large, most observations tend to cluster around the average value while extreme values become increasingly rare.
This behavior is one of the defining characteristics of a normal distribution.
Why Is Normal Distribution So Important in SPC?
At its core, SPC is about:
Using statistical principles to determine whether a manufacturing process is stable.
Many traditional SPC methods assume that process data is approximately normally distributed.
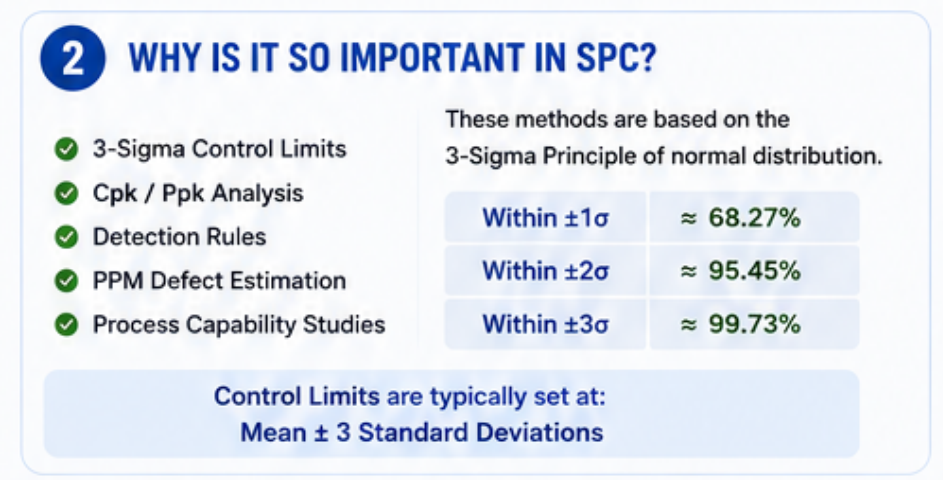
Examples include:
- 3-Sigma Control Limits
- Cpk Analysis
- Ppk Analysis
- SPC Detection Rules
- PPM Defect Rate Estimation
All of these rely heavily on the properties of normal distribution.
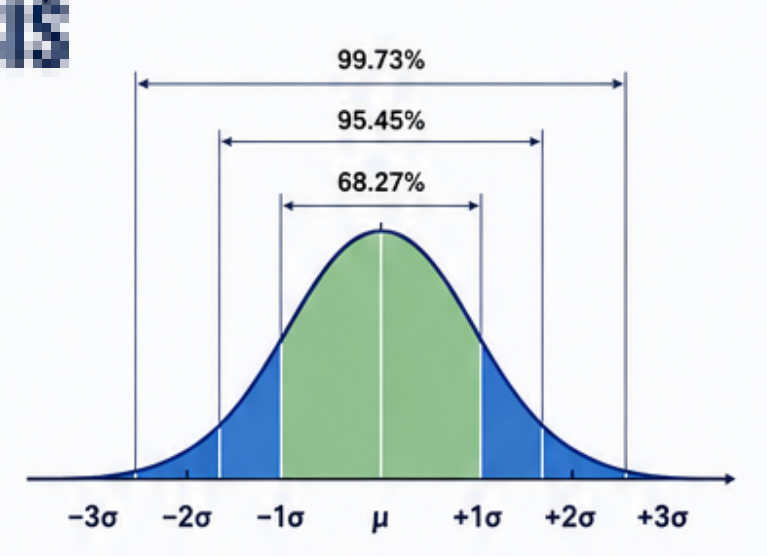
According to classical statistical theory:
- Approximately 68.27% of data falls within ±1σ
- Approximately 95.45% falls within ±2σ
- Approximately 99.73% falls within ±3σ
This famous relationship is often referred to as the 3-Sigma Principle.
Because of this principle, SPC control charts typically define:
- UCL (Upper Control Limit)
- LCL (Lower Control Limit)
based on:
Mean ± 3 Standard Deviations
This statistical framework allows SPC systems to distinguish normal process variation from potential abnormalities.
Why Do Manufacturing Data Often Resemble a Normal Distribution?
In real-world manufacturing environments, a quality characteristic is rarely influenced by a single factor.
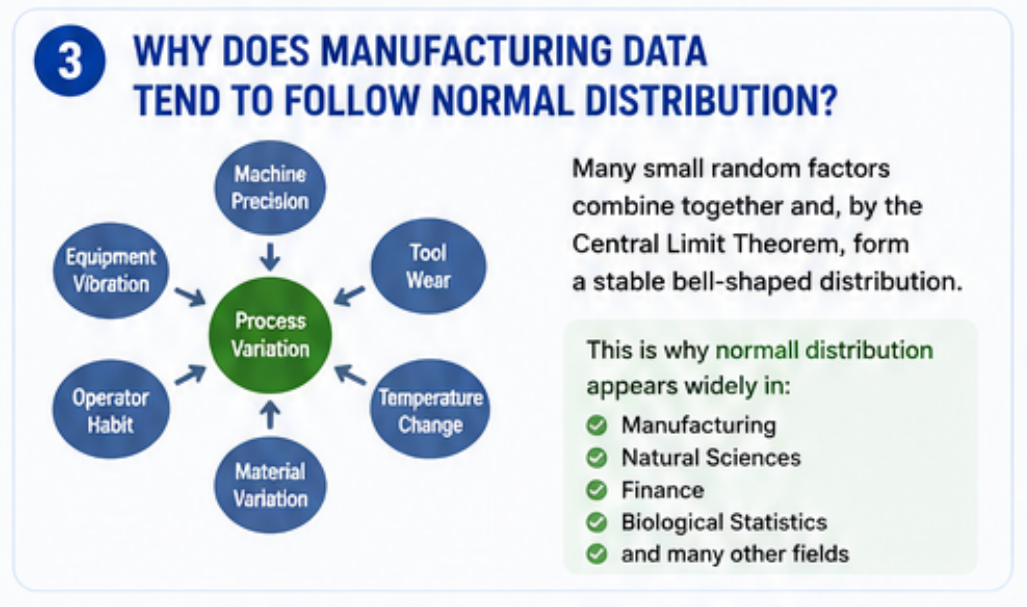
Instead, it is affected by many independent sources of variation, such as:
- Machine precision
- Tool wear
- Temperature fluctuations
- Material variation
- Operator behavior
- Equipment vibration
Individually, these factors may have only a small impact.
However, when many random influences combine together, the resulting measurements tend to form a stable bell-shaped distribution.
This phenomenon is a direct consequence of statistical laws and explains why normal distributions appear so frequently in:
- Manufacturing
- Natural Sciences
- Finance
- Biology
- Engineering
Normal distribution is not simply a mathematical invention—it is often the natural result of many independent random influences acting together.
Mean and Standard Deviation: The Two Core Parameters
Every normal distribution is defined by two critical parameters.
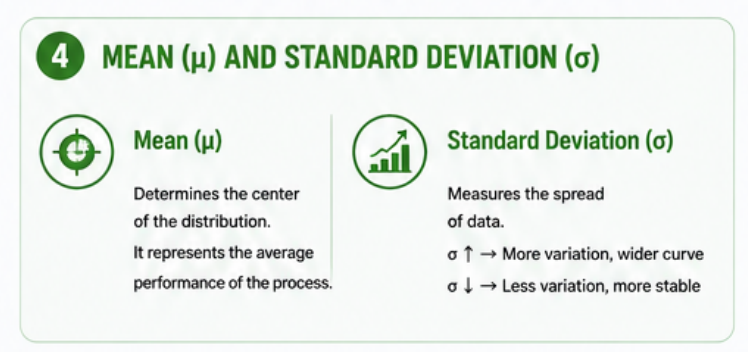
Mean
The Mean determines the center of the distribution.
It represents the location of the highest point of the bell curve and reflects the average performance of the process.
Standard Deviation
The Standard Deviation measures process variation.
A larger standard deviation means:
- Greater dispersion
- Wider distribution
- More variability
A smaller standard deviation means:
- Data points are more concentrated
- The process is more stable
- Variation is lower
In SPC and process capability analysis, standard deviation plays a direct role in determining capability performance.
Why Does Cpk Depend So Heavily on Normal Distribution?
Cpk is designed to evaluate:
Whether process variation consistently remains within specification limits.
To calculate Cpk accurately, the analysis relies on:
- Standard deviation
- Probability distributions
- Defect probability estimation
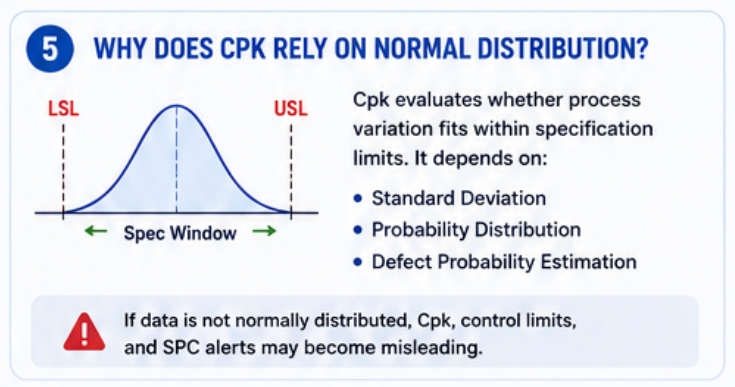
All of these calculations assume that the underlying process follows a normal distribution.
If the data significantly deviates from normality:
- Cpk values may become misleading
- Control limits may be inappropriate
- SPC alerts may generate false alarms
- Process capability may be incorrectly evaluated
This is one reason why some organizations experience situations where:
"The SPC system keeps generating alarms, but production personnel eventually stop responding."
The issue is often not the SPC system itself.
The problem may be that the underlying statistical assumptions are no longer valid.
Not All Manufacturing Data Are Normally Distributed
Many traditional SPC software packages automatically assume that all process data follows a normal distribution.
In reality, this is often not true.

Examples of non-normal manufacturing data include:
- Reliability testing data
- Chemical process measurements
- Battery capacity data
- Semiconductor process data
- Thickness measurements
These data sets may exhibit:
- Skewed distributions
- Long-tail distributions
- Multi-modal distributions
Applying traditional Cpk analysis directly to such data can result in:
- Incorrect capability assessments
- Misleading quality conclusions
- Inaccurate SPC analysis
For this reason, verifying distribution characteristics before performing Cpk analysis is a critical statistical requirement.
Non-Normal Data Analysis in NexSPC
To address the challenges of modern manufacturing environments, NexSPC includes a dedicated Process Capability Analysis module that supports non-normal data analysis.
Users can import process data and perform:
- Non-Normal Capability Analysis
- Box-Cox Transformation
- Distribution Fitting
- Normality Testing
- Anderson-Darling (AD) Testing
- P-Value Analysis
These tools help quality engineers determine whether traditional Cpk analysis is appropriate for a given dataset.

Built-In Normality Analysis
Within the NexSPC Capability Analysis module, the system automatically generates:
- Normal Probability Plots
- Anderson-Darling Statistics
- P-Value Results
allowing users to quickly evaluate whether data satisfies the assumptions required for conventional capability analysis.
The platform also supports multiple distribution models, including:
- Normal Distribution
- Lognormal Distribution
- Weibull Distribution
and other advanced distribution fitting methods.
These capabilities are particularly valuable in industries such as:
- Semiconductor Manufacturing
- Battery Production
- Medical Devices
- Chemical Processing
- Reliability and Lifetime Testing
where non-normal data is common.
Why Modern SPC Is Increasingly Focused on Non-Normal Analysis
As smart manufacturing continues to evolve, more organizations are recognizing that:
Not all quality data naturally follows a normal distribution.
As a result, modern SPC systems must provide more than:
- Control Charts
- Cpk Analysis
- Detection Rules
They must also validate the statistical assumptions behind the data itself.
This shift represents one of the key differences between traditional SPC and modern quality analytics.
Normal Distribution Is More Than a Bell Curve
Normal distribution is not simply a textbook concept.
It is one of the fundamental building blocks of:
- SPC
- Cpk
- Process Capability Analysis
- Modern Quality Statistics
Understanding normal distribution helps manufacturers answer critical questions such as:
- Why do SPC violations occur?
- Why can Cpk results become misleading?
- Why do some control charts generate false alarms?
- Why is non-normal analysis necessary?
With the advanced capability analysis tools provided by NexSPC, organizations can perform:
- Normality Testing
- Distribution Fitting
- Non-Normal Data Analysis
- Process Capability Studies
to establish a more reliable and statistically sound foundation for quality improvement.

Conclusion
Normal distribution remains one of the most important concepts in SPC and quality engineering.
By understanding how data is distributed—and validating whether traditional assumptions remain valid—manufacturers can make better decisions, avoid misleading conclusions, and improve process capability assessments.
Modern quality management is no longer about applying statistical formulas blindly.
It is about understanding the data first.
And that is exactly why normal distribution remains the foundation of effective SPC analysis.