As manufacturers accelerate their digital transformation initiatives, real-time visibility into quality performance is becoming a critical competitive advantage.
In traditional quality management environments, SPC (Statistical Process Control) data often remains isolated on the computers of quality engineers. Shop-floor operators, supervisors, and production managers typically lack access to real-time quality information, resulting in a common problem:
Defects are discovered only after products have already been produced.
NexSPC (formerly Bingo SPC) addresses this challenge with its powerful Real-Time Dashboard Solution, enabling manufacturers to transform quality data into actionable insights across every level of the organization.
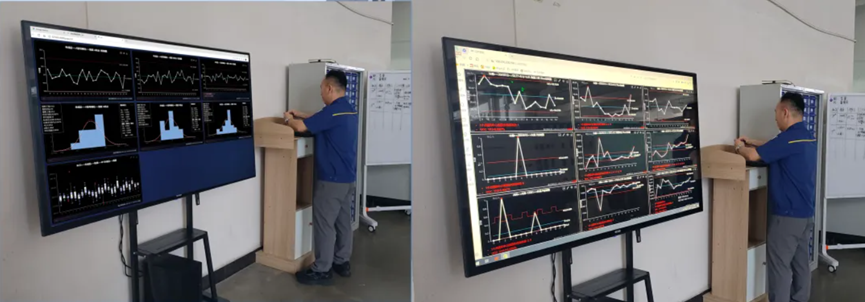
Built on a pure Web-based (B/S) architecture, NexSPC allows companies to deploy full-featured SPC monitoring dashboards through any web browser. Data updates occur in real time with millisecond-level responsiveness—without manual page refreshes.
Five Powerful Dashboard Engines for Every Level of Manufacturing
NexSPC supports unlimited dashboard creation and provides multiple dashboard types designed for different operational and management needs. From individual workstations to executive command centers, every stakeholder gains access to the information that matters most.
1. Comparative Analysis Dashboard: A Powerful Tool for Root Cause Investigation
When product quality fluctuates, manufacturers must quickly determine whether the source of variation comes from:
- Equipment
- Operators
- Materials
- Process settings
The Comparative Analysis Dashboard allows users to compare the same quality characteristic across different dimensions, such as:
- Machine A vs. Machine B vs. Machine C
- Different production lines
- Different process parameter settings
The system displays:
- Individual (I) Control Charts
- Process Capability Histograms
- Cpk and Ppk Comparisons
side by side, making it easy to identify performance differences and pinpoint sources of variation.
A real-world injection molding manufacturer used NexSPC to compare machine performance and process parameter configurations in real time, enabling engineers to move beyond trial-and-error troubleshooting and identify root causes through data-driven analysis.
2. Active Production Dashboard: Focus Only on What Is Running Now
Manufacturers often manage thousands of inspection characteristics.
Traditional dashboards frequently become cluttered with inactive historical projects.
NexSPC solves this problem through intelligent activity-based rotation.
The system automatically identifies quality characteristics with recent data updates and dynamically displays:
- Control Charts
- Capability Histograms
- Process Status Information
based on:
- Today's production
- This week's production
- User-defined activity periods
This ensures dashboard space is always dedicated to currently active manufacturing operations.
This feature is particularly valuable for:
- High-mix manufacturing
- Low-volume production
- Flexible manufacturing environments
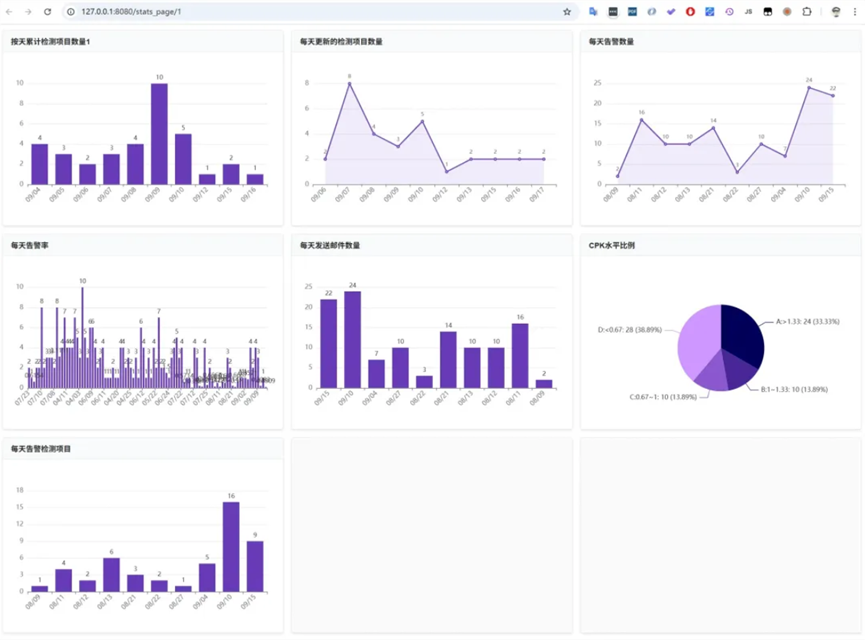
3. Comprehensive Evaluation Dashboard: Rapid Quality Risk Screening
When production lines contain dozens of Critical-to-Quality (CTQ) characteristics, traditional dashboard layouts become difficult to manage.
The Comprehensive Evaluation Dashboard uses a high-density card and list-based design to provide a factory-wide overview of quality performance.
Key metrics include:
- Number of SPC violations
- Cpk values
- Ppk values
- Quality grades (A/B/C/D)
allowing supervisors and quality managers to rapidly identify risks and prioritize improvement efforts.

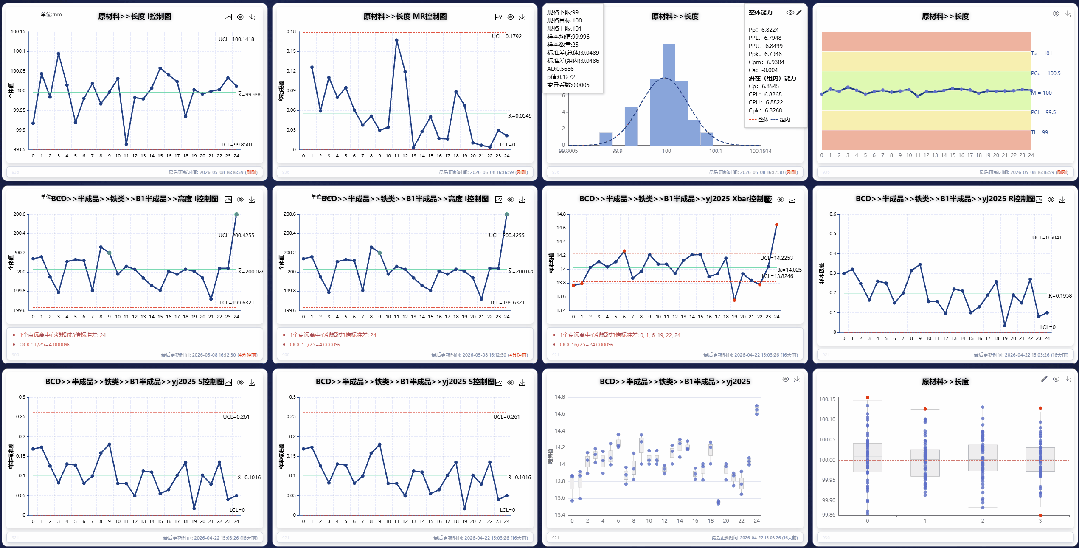
4. Mixed-Type Dynamic Dashboard: Customized Monitoring for Every Process
Different manufacturing processes require different SPC models.
The Mixed-Type Dashboard allows multiple chart types to coexist on a single screen, including:
- I-MR Control Charts
- Xbar-R Control Charts
- Xbar-S Control Charts
- P Charts
- U Charts
- Pre-Control Charts (Rainbow Charts)
This flexibility enables manufacturers to tailor dashboards to the unique needs of each production area.
NexSPC supports 13 SPC detection rules, including the classic Western Electric rules, ensuring accurate abnormality detection across a wide range of manufacturing processes.
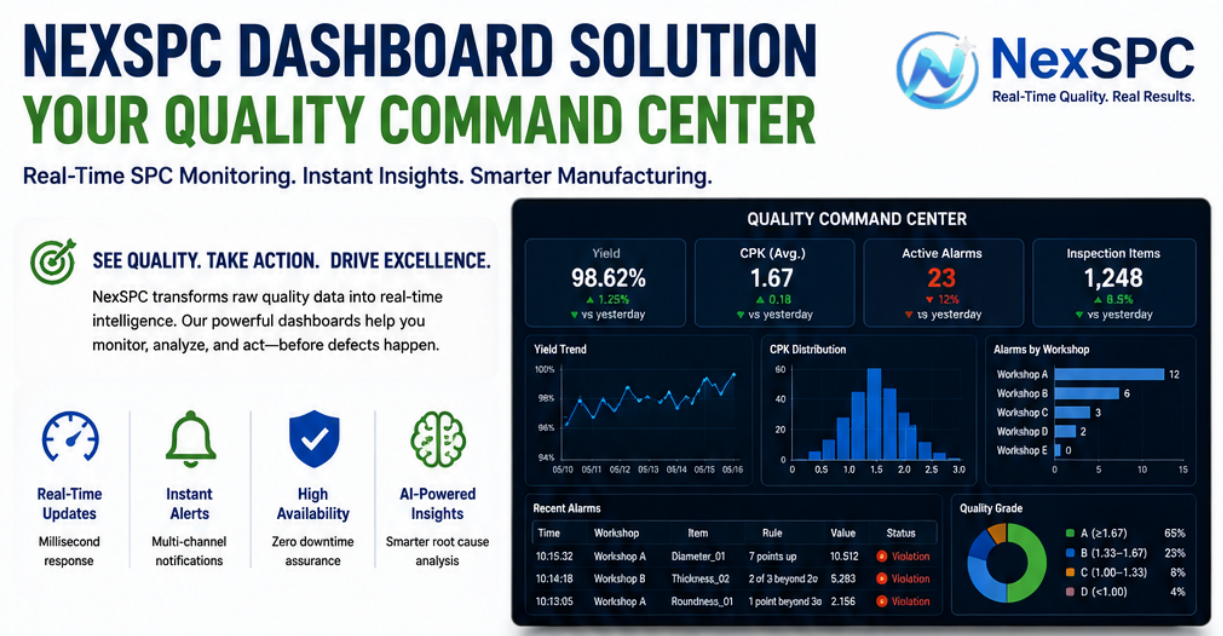
5. Executive Dashboard: The Factory-Wide Quality Command Center
Quality directors and plant managers require a broader perspective than individual control charts.
The Executive Dashboard provides a high-level view of overall manufacturing quality performance.
Users can configure:
- Yield Trends
- Workshop Comparisons
- Alarm Rates
- Quality Performance KPIs
- Production Quality Summaries
through flexible SQL-based data integration and custom visualizations.
This creates a true factory-wide quality command center that supports strategic, data-driven decision-making.
Industrial-Grade Features Beyond Visualization
A dashboard is only valuable if it delivers reliable, actionable information.
NexSPC combines powerful visualization capabilities with enterprise-grade infrastructure.
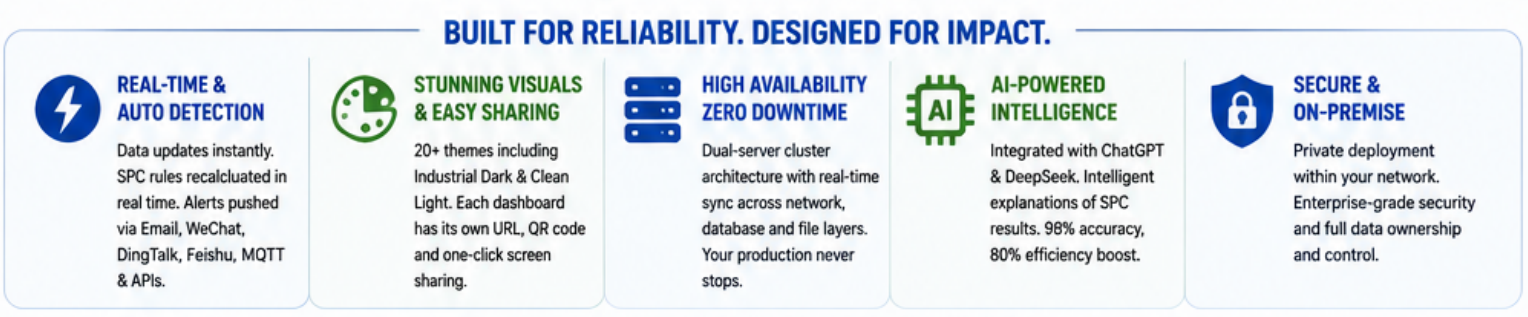
Real-Time Updates and Automatic SPC Detection
Whenever new data enters the system:
- Dashboards update automatically
- SPC rules are recalculated instantly
- Capability metrics are refreshed
When abnormalities occur—such as a continuous upward trend or SPC rule violation—the system immediately triggers alerts through:
- Microsoft Teams-compatible integrations
- DingTalk
- Lark (Feishu)
- MQTT
- Open APIs
This enables second-level response times for quality incidents.
Flexible Visual Design
Every dashboard automatically generates its own unique URL.
Users can:
- Open dashboards directly in browsers
- Display dashboards on large factory screens
- Share dashboards through QR codes
- Embed dashboards into operational centers
NexSPC includes multiple built-in themes, including:
- Industrial Dark Mode
- Light Mode
- Custom Visual Themes
to support different production environments and corporate branding requirements.
High Availability with Zero-Downtime Architecture
NexSPC Enterprise Edition supports industrial-grade high availability.
The platform utilizes:
- Dual-server clustering
- Database redundancy
- Real-time file synchronization
- Hot standby architecture
to ensure uninterrupted operation.
Production dashboards and automated data collection continue running seamlessly even during hardware failures or maintenance activities.
AI-Powered Quality Intelligence
NexSPC integrates advanced AI technologies, including large language models, to provide intelligent interpretation of SPC results.
The system can:
- Explain SPC violations
- Analyze potential causes
- Recommend corrective actions
- Assist quality engineers with investigation
helping organizations improve analysis efficiency while accelerating root-cause identification.
Proven Across Multiple Industries
NexSPC dashboards have been successfully deployed across a wide range of industries.
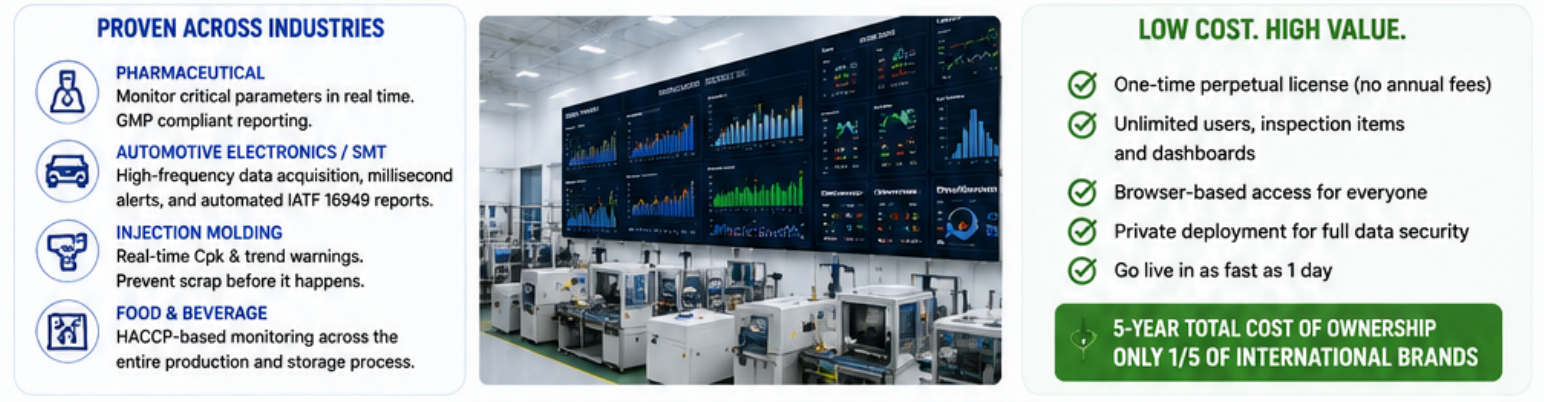
Pharmaceutical Manufacturing
Real-time monitoring of:
- Temperature
- Humidity
- pH
- Concentration
while automatically generating compliance reports that support GMP requirements and regulatory audits.
Automotive Electronics & SMT
Supporting:
- SPI
- AOI
- Printing
- Placement
- Reflow
- Inspection
with millisecond-level alerts and automated process capability reporting for IATF 16949 compliance.
Injection Molding
Real-time Cpk monitoring and trend-based early warning systems help identify mold wear and process drift before scrap is produced.
Food Manufacturing
Monitoring critical control points throughout:
- Raw Material Processing
- Production
- Packaging
- Warehousing
while supporting HACCP-based quality management requirements.
Exceptional Cost Efficiency and Fast Deployment
Unlike traditional SPC systems that rely on subscription-based pricing, NexSPC provides:
- Perpetual server licensing
- Unlimited users
- Unlimited inspection characteristics
- Unlimited dashboards
with no annual licensing fees.
Additional benefits include:
- Private on-premises deployment
- Rapid implementation
- Browser-based access
- Enterprise-level data security
Many manufacturers can deploy the platform in as little as one day.
Conclusion
Modern manufacturing requires more than static reports and delayed quality information.
Manufacturers need:
- Real-time visibility
- Immediate alerts
- Data-driven decision support
- Factory-wide quality transparency
NexSPC dashboards help organizations transform quality management from:
Reactive Correction → Proactive Prevention
and from:
Historical Reporting → Real-Time Operational Intelligence
Whether on the production floor, in the supervisor's office, or within the executive command center, NexSPC makes quality performance visible, actionable, and measurable across the entire enterprise.