














Anyone working in quality management is probably very familiar with this number:
Cpk ≥ 1.33
But have you ever seriously thought about it?
- Why exactly 1.33?
- Why not 1.0, 1.5, or even higher?
- Why do so many customers treat it as a “hard requirement”?
Many companies follow this standard, but relatively few truly understand the logic behind it.
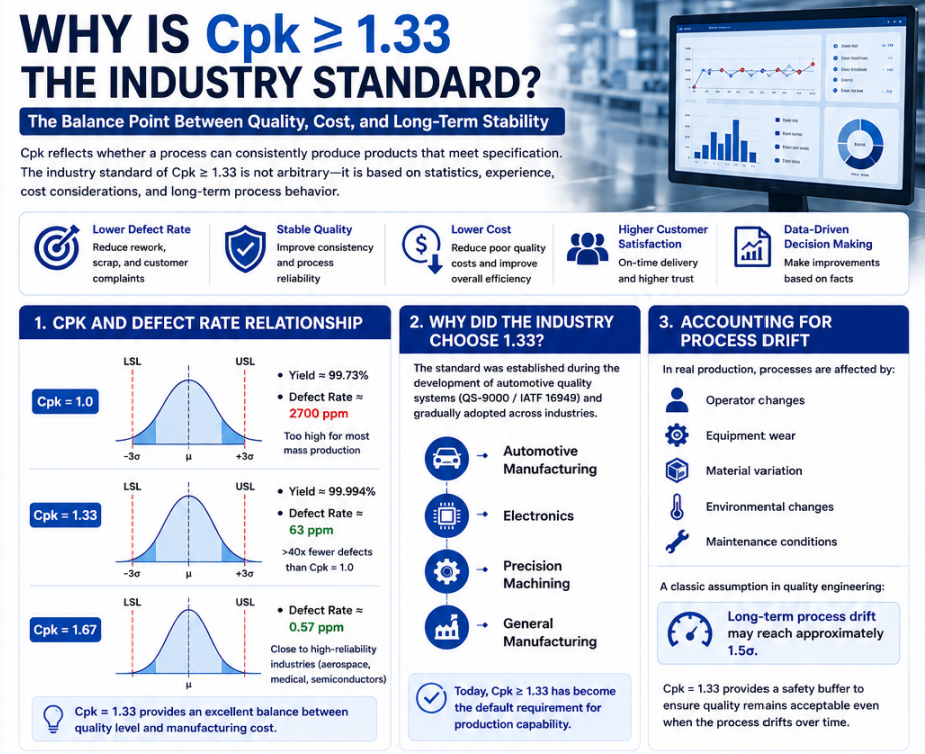
1. First, Look at the Relationship Between Cpk and Defect Rate
Different Cpk values correspond to dramatically different quality levels.
Cpk = 1.0
- Yield rate ≈ 99.73%
- Defect rate ≈ 2700 ppm
At first glance, 99.73% may sound very good.
But for mass production, 2700 ppm can still mean a large number of defective products.
For example:
If a factory produces 1 million parts per month:
- 2700 ppm means about 2,700 defective parts every month
For industries such as automotive, electronics, semiconductors, or medical devices, this defect level is often unacceptable.
Cpk = 1.33
- Yield rate ≈ 99.994%
- Defect rate ≈ 63 ppm
Compared with Cpk = 1.0:
- Defects are reduced from 2700 ppm to only 63 ppm
- More than 40 times fewer defects
At the same time:
- Manufacturing cost is still within a reasonable and controllable range for most companies.
This is why:
1.33 is widely considered the balance point between quality and cost.
Cpk = 1.67
- Defect rate ≈ 0.57 ppm
This level is already close to the requirements of highly reliable industries such as:
- Aerospace
- Medical devices
- High-end semiconductors
However, achieving Cpk ≥ 1.67 usually requires:
- Tighter process control
- Higher equipment precision
- More stable materials
- Better environmental control
- Increased manufacturing cost
For many industries, the cost-benefit ratio may no longer be ideal.
2. Why Did the Industry Choose 1.33?
The standard was not chosen randomly.
During the development of automotive quality systems, standards such as:
- QS-9000
- Later IATF 16949
gradually established: Cpk ≥ 1.33
as an important requirement for supplier production capability.
Over time, this standard spread widely across industries including:
- Automotive manufacturing
- Electronics
- Precision machining
- General manufacturing
and gradually became the “default industry standard.”
3. Another Critical Reason: Processes Drift Over Time
One important reality is often overlooked:
Production processes do not remain perfectly stable forever.
Over time, processes are affected by:
- Operator changes
- Equipment wear
- Raw material variation
- Environmental fluctuation
- Maintenance conditions
As a result:
The process mean tends to shift.
In quality engineering, there is a classic assumption:
Long-term process drift may reach approximately 1.5σ.
This means:
Even if the short-term process capability appears excellent,
the long-term capability may deteriorate over time.
That is why:
Cpk = 1.33 actually provides a safety buffer for long-term production variation.
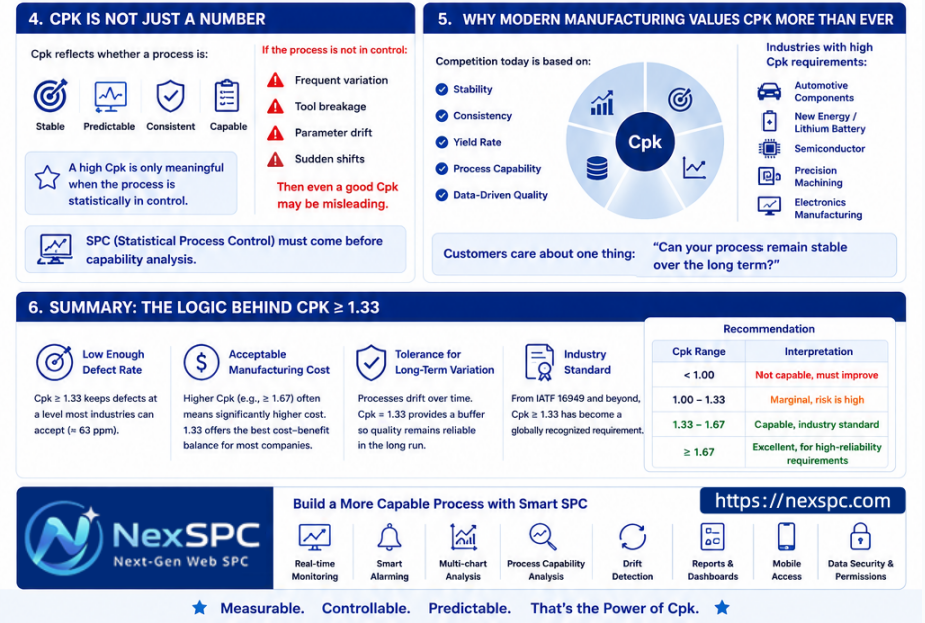
4. Cpk Is Not Just a Number
Many people focus only on whether the value is “above 1.33.”
But the real purpose of Cpk is not simply passing an audit.
Cpk reflects whether a process is:
- Stable
- Predictable
- Consistent
- Capable of meeting specifications continuously
More importantly:
A high Cpk is meaningful only when the process is statistically in control.
If the process is unstable:
- Frequent abnormal variation
- Tool breakage
- Parameter drift
- Sudden shifts
then even a “good-looking” Cpk may be misleading.
This is why SPC (Statistical Process Control) must always come before capability analysis.
5. Why Modern Manufacturing Is Paying More Attention to Cpk
In today’s manufacturing environment, competition is no longer based only on:
- Production volume
- Labor cost
- Scale
More and more companies compete on:
- Stability
- Consistency
- Yield rate
- Process capability
- Data-driven quality management
Especially in industries such as:
- New energy
- Lithium battery
- Semiconductor
- Automotive components
- Precision machining
- Electronics manufacturing
customers care deeply about one question:
“Can your process remain stable over the long term?”
And Cpk has become one of the most widely recognized indicators of that capability.
6. The Challenge: Traditional SPC Is Becoming Less Effective
Although Cpk remains important, modern manufacturing also faces new challenges.
Traditional SPC methods were originally designed for:
- Low-frequency sampling
- Small datasets
- Manual inspection environments
But today’s factories increasingly rely on:
- High-frequency data collection
- Real-time monitoring
- Automated production
- Massive data streams
As a result:
Traditional SPC systems often suffer from:
- Excessive false alarms
- Too many red points
- Difficulty identifying long-term drift
- Noise masking real abnormalities
This is why more companies are moving toward:
- Intelligent SPC
- AI-assisted anomaly detection
- Drift analysis
- Baseline and oscillation separation
- Smart process monitoring
7. Summary
So, the reason behind Cpk ≥ 1.33 is essentially a balance among:
√Low enough defect rates
√Acceptable manufacturing cost
√ Tolerance for long-term process drift
√Industry-standardized quality expectations
If Cpk is below 1.33:
- Quality risk increases significantly.
If Cpk is much higher than 1.67:
- Manufacturing cost may become unnecessarily high for many industries.
That is why:
1.33 gradually became the default process capability threshold in manufacturing.
So, what is your company’s current Cpk requirement?