














Why Modern Manufacturers Need More Than Conventional Control Charts
Every quality engineer has experienced this situation.
An SPC control chart suddenly turns red.
The maintenance team replaces the cutting tool.
The machine is recalibrated.
Offsets are adjusted.
Yet the alarms continue.
After several rounds of troubleshooting, production is interrupted, scrap parts begin to accumulate, and everyone starts asking the same question:
"Why is the process still out of control?"
In many factories, the first response is to suspect equipment failure. Engineers inspect the machine, replace components, tighten fixtures, or modify machining parameters. Sometimes these actions help. More often, they simply introduce new variables that make the process even less stable.
The real problem is not necessarily the machine.
It is the way traditional SPC interprets process variation.
Most SPC systems are excellent at telling engineers when a process is abnormal. Very few can explain why the abnormality occurs or distinguish different types of variation hidden within the same control chart.
As manufacturing becomes increasingly automated and production lines become more complex, this limitation has become one of the biggest obstacles to effective root cause analysis.
Why Traditional SPC Often Leads Engineers in the Wrong Direction
Traditional SPC was developed for monitoring process stability.
Control charts, Western Electric Rules, and capability analysis remain highly effective tools for identifying unusual process behavior. However, these methods were originally designed under the assumption that a process is influenced primarily by a single dominant source of variation.
Modern manufacturing rarely behaves that way.
Today's production environments involve multiple machines, automated workstations, robotic handling systems, multi-cavity molds, intelligent fixtures, and continuously changing production conditions. Several independent sources of variation often exist simultaneously, producing a signal that is far more complicated than a conventional control chart can explain.
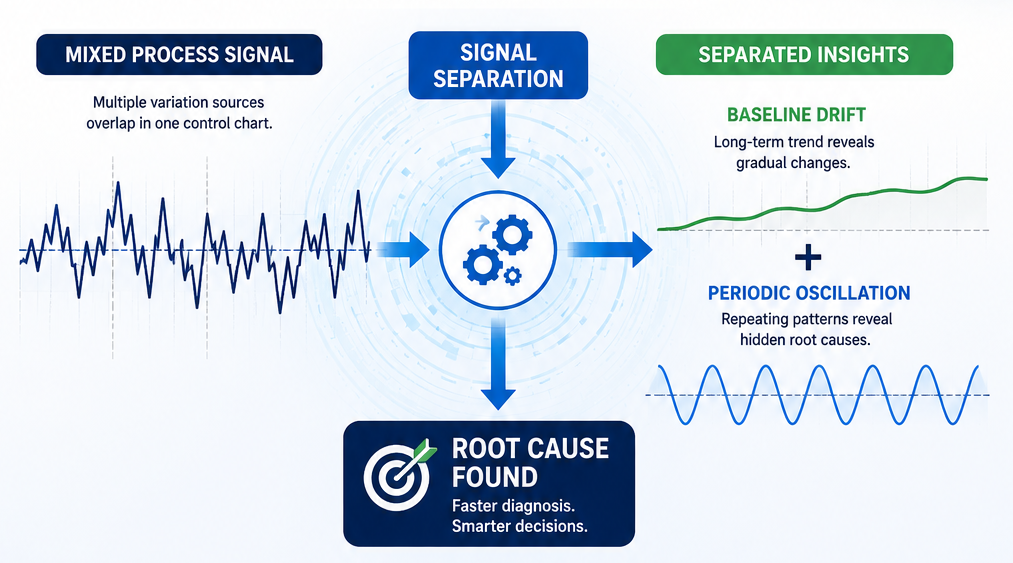
When multiple variation patterns overlap, the control chart only displays the final result—a mixed signal.
To the engineer, the chart simply appears unstable.
The software reports an out-of-control condition.
But it cannot answer the questions that matter most:
- Is the trend caused by gradual tool wear?
- Is the fluctuation coming from machine vibration?
- Is one workstation behaving differently from the others?
- Are periodic process cycles creating repeating patterns?
Without these answers, troubleshooting quickly becomes a process of elimination rather than scientific diagnosis.
One Control Chart, Multiple Sources of Variation
Imagine a precision machining line producing critical automotive components.
During several hours of production, the measured dimensions begin to drift upward slowly.
At the same time, every fourth workpiece shows a noticeably different measurement.
Looking only at the SPC chart, engineers see two overlapping behaviors:
- A slow upward trend suggesting progressive tool wear.
- Regular oscillations indicating a repeating mechanical influence.
Traditional SPC treats these as one combined signal.
As a result, engineers may replace cutting tools, recalibrate offsets, and inspect the spindle—while completely overlooking the actual source of the periodic variation.
Hours are lost.
Production efficiency drops.
And unnecessary adjustments introduce even more variation into the process.
This phenomenon is far more common than many manufacturers realize.
Two Types of Process Variation Every Quality Engineer Should Understand
Although every production process is unique, most complex SPC signals can be viewed as the combination of two fundamental types of variation.
Baseline Drift
Baseline drift represents long-term process movement.
It develops gradually and continuously over time, often resulting from predictable physical changes such as:
- Progressive tool wear
- Thermal expansion
- Grinding wheel wear
- Coolant concentration changes
- Equipment aging
These changes occur slowly and usually follow a clear trend.
Because baseline drift develops over many production cycles, it often provides valuable information about process health and equipment condition.
Periodic Oscillation
Periodic oscillation behaves very differently.
Instead of moving continuously in one direction, it repeats at fixed intervals.
Common causes include:
- Multi-cavity molds
- Rotary indexing tables
- Fixture positioning errors
- Servo motion cycles
- Machine vibration
- Repeating workstation differences
Unlike baseline drift, periodic oscillation does not necessarily indicate gradual deterioration.
Instead, it points to a repeating event somewhere within the manufacturing process.
Recognizing this distinction is critical.
If engineers mistake periodic oscillation for baseline drift, they may repeatedly compensate machine offsets without addressing the real mechanical cause.
If they mistake baseline drift for vibration, they may waste hours inspecting equipment that is functioning normally.
The Hidden Cost of Over-Adjustment
One of the most expensive consequences of traditional SPC is unnecessary process adjustment.
Whenever operators see repeated SPC alarms, the natural reaction is to make corrections.
Offsets are changed.
Machine parameters are modified.
Tools are replaced earlier than necessary.
While these actions appear logical, they often make the situation worse.
In quality engineering, this behavior is known as process tampering or over-adjustment.
Rather than stabilizing production, excessive intervention introduces additional variation into an otherwise predictable process.
Ironically, many manufacturers create instability while attempting to eliminate it.
The process was never truly out of control.
It was simply misunderstood.
Modern quality management is therefore shifting away from simple abnormality detection toward intelligent interpretation of process variation.
Understanding what type of variation is occurring is becoming just as important as detecting that variation in the first place.
How NexSPC Separates Process Signals Before Analysis
Instead of treating every fluctuation as one continuous signal, NexSPC applies a different analytical philosophy.
Rather than asking:
"Is the process abnormal?"
the system first asks:
"What is the process actually composed of?"
This seemingly simple difference changes the entire approach to SPC analysis.
NexSPC introduces Baseline & Oscillation Separation™, an advanced signal analysis technology designed specifically for complex manufacturing environments.
Instead of evaluating the raw measurement sequence directly, the system decomposes the process into independent components before applying SPC rules.
The objective is not to generate more alarms.
The objective is to understand the origin of process variation.
Step 1: Identify the Long-Term Process Trend
The first stage extracts the underlying baseline trend from the measured data.
This baseline represents the slow movement of the process center over time while filtering out short-term fluctuations.
For quality engineers, this provides immediate answers to questions such as:
- Is the process gradually drifting?
- Is tool wear becoming significant?
- Is thermal expansion affecting dimensions?
- Is preventive maintenance approaching?
Instead of reacting to every fluctuation, engineers can evaluate whether the process itself is actually changing.
If the baseline remains stable, unnecessary machine adjustments can often be avoided.
If the baseline shows a continuous upward or downward trend, the system can recommend planned intervention before the process reaches specification limits.
This transforms SPC from a reactive monitoring tool into a predictive decision-support system.
Step 2: Isolate Periodic Variation
Once the baseline has been separated, NexSPC analyzes the remaining signal independently.
This residual data often contains repeating patterns that are almost impossible to recognize on a traditional control chart.
Examples include:
- Every fourth workpiece deviates.
- Every machine cycle produces a repeating fluctuation.
- One cavity consistently differs from the others.
- One workstation introduces additional variation during each production cycle.
Although these patterns appear random on a standard control chart, they become highly visible after signal separation.
Instead of viewing the process as "unstable," engineers can begin identifying specific mechanical or operational sources of variation.
FFT Frequency Analysis: Looking Beyond the Time Domain
Some manufacturing problems cannot be identified simply by looking at measurements over time.
To uncover hidden periodic behavior, NexSPC applies Fast Fourier Transform (FFT) analysis.
FFT converts measurement data from the time domain into the frequency domain, allowing engineers to identify repeating cycles that would otherwise remain hidden.
Rather than asking:
"When did the abnormality occur?"
FFT answers a different question:
"How often does the abnormality repeat?"
This provides valuable clues for root cause analysis.
For example:
- A dominant frequency corresponding to every four production cycles may indicate a four-station rotary table.
- A repeating peak every eight measurements may point to a multi-cavity mold.
- A fixed vibration frequency may reveal spindle imbalance or bearing wear.
Instead of relying on experience alone, engineers gain objective evidence that links statistical patterns to physical manufacturing behavior.
Case Study: Finding the Real Problem at Workstation #4
A precision machining manufacturer experienced recurring SPC alarms on a critical dimension.
The production team responded exactly as expected.
Cutting tools were replaced.
Machine offsets were adjusted.
Inspection equipment was recalibrated.
Despite multiple interventions, the alarms continued.
Traditional SPC confirmed that the process was unstable—but provided no explanation.
Using NexSPC's Baseline & Oscillation Separation™, engineers analyzed the same dataset from a different perspective.
The baseline trend remained relatively stable.
However, the oscillation analysis revealed a highly consistent repeating pattern.
FFT analysis identified a dominant period of T = 4.
This immediately shifted the investigation from the cutting process to the production sequence.
The manufacturing line consisted of four identical workstations.
Further inspection discovered that Workstation #4 had a slightly worn positioning fixture.
Each time a component passed through this station, a small dimensional deviation was introduced.
Because the deviation repeated every four production cycles, it was almost invisible on a traditional control chart but became immediately obvious after signal decomposition.
Replacing a low-cost fixture solved the problem within hours.
No further machine adjustments were required.
This illustrates an important principle:
The fastest root cause analysis begins with understanding the structure of process variation—not simply reacting to alarms.
From Process Monitoring to Process Diagnosis
For decades, SPC has focused on one primary objective:
Detecting abnormal variation.
Modern manufacturing demands more.
Quality engineers now need systems capable of explaining:
- Why variation occurs.
- Where it originates.
- Whether it is gradual or periodic.
- Which corrective action is most appropriate.
This represents a fundamental shift in the role of SPC.
Instead of acting as a statistical reporting tool, modern SPC becomes an engineering diagnostic platform.
It supports maintenance planning.
It improves troubleshooting efficiency.
It reduces unnecessary intervention.
And most importantly, it helps manufacturers solve problems faster.
Why This Matters for Smart Manufacturing
As factories continue adopting Industrial IoT, automated inspection, and AI-assisted quality management, manufacturing processes generate more data than ever before.
The challenge is no longer collecting data.
The challenge is extracting meaningful engineering knowledge from that data.
Signal separation, frequency analysis, and intelligent diagnosis represent the next stage in the evolution of SPC.
Manufacturers that continue relying solely on traditional control charts may detect abnormalities.
Manufacturers that understand the composition of process variation can prevent those abnormalities from becoming costly production problems.
Conclusion
Traditional SPC has played a vital role in quality management for decades.
However, increasingly complex manufacturing systems require more than statistical monitoring alone.
By separating baseline drift from periodic oscillation and combining advanced frequency analysis with conventional SPC techniques, manufacturers gain a much clearer understanding of how and why processes behave the way they do.
Rather than asking engineers to respond to every alarm, NexSPC helps them identify the true source of variation, reduce unnecessary adjustments, and make faster, more confident decisions.
Because the future of SPC is not simply about detecting abnormal data.
It is about understanding the signal behind the data.