














One of the most common statements in the quality industry is:
"Cpk measures short-term process capability, while Ppk measures long-term process performance."
Then someone inevitably asks:
How short is "short-term"? How long is "long-term"?
Some experts suggest that three months should be considered short-term, while six months represents long-term performance.
Naturally, another question follows:
If three months is considered short-term, what about 89 days? Or 60 days? What if the data is collected over exactly one day less than three months?
The discussion quickly becomes confusing.
So which interpretation is actually correct?
Those who have followed our previous technical articles may remember that we've consistently emphasized a different perspective:
Cpk is applicable to stable and statistically controlled processes because it is intended to predict future process capability.
Ppk, on the other hand, can be calculated for any process because it simply describes historical process performance.
The real distinction is not based on time, nor on the number of data points collected.
Instead, it depends on two fundamental questions:
- Is the process statistically stable?
- Does the data satisfy the assumptions required by the selected capability index?
With the release of the AIAG-VDA SPC Manual (2026 Edition), another capability index has attracted significant attention:
Cpk.g
What exactly is Cpk.g?
Why does the new AIAG-VDA methodology state that Cpk.g = Ppk.g?
How many data points are required before it can be calculated reliably?
In this article, we'll answer these questions one by one.
1. What Does the ".g" Suffix Actually Mean?
The ".g" suffix was introduced in the ISO 22514 and ISO 3534 series of standards.
Rather than indicating a new mathematical formula, the suffix identifies the boundary conditions under which the data was collected and the control status of the manufacturing process.
To make the concept easier to understand, the AIAG-VDA SPC Manual provides several representative examples.
Pm.g / Pmk.g
These indices describe process capability based only on the influence of the machine itself.
During the study, all other process factors—including the remaining elements of the traditional 5M (Man, Method, Material, and Mother Nature/Environment)—are assumed to remain constant.
In other words, the capability evaluation reflects only machine variation under tightly controlled conditions.
Pp.g / Cpk.g
These represent the complete process capability indices.
Unlike Pm.g, they consider the influence of all relevant process factors, including people, machines, materials, methods, measurement systems, and the manufacturing environment.
However, there is one essential prerequisite.
To report a capability index as Cpk.g, the manufacturing process must already satisfy the definition of a capable process.
That means the process must first be demonstrated to be statistically stable and under control, typically verified using appropriate SPC control charts.
If the process is unstable or contains special-cause variation, the same calculation no longer represents process capability in the predictive sense.
Why Is Cpk.g Different from Traditional Cpk?
In practice, many manufacturers collect a set of production data and calculate a conventional Cpk without first confirming whether the process is actually under statistical control.
Cpk.g adopts a stricter philosophy.
Before calculating the index, manufacturers should be able to state with confidence:
- The effects of people, machines, materials, methods, measurement systems, and the environment have all been properly considered.
- The process is operating under statistical control.
- The control charts confirm that the process is stable.
Only under these conditions does the resulting index represent true process capability rather than merely historical process performance.
This distinction is one of the fundamental concepts introduced by the latest AIAG-VDA SPC methodology.
2. How Is Cpk.g Calculated? Why Does It Use Percentiles Instead of Standard Deviation?
The biggest difference between traditional Cpk and Cpk.g is not the capability formula itself.
Instead, it lies in how process variation is estimated.
Traditional Cpk assumes that the manufacturing data follows a normal distribution.
Under this assumption, process variation is estimated using the familiar statistical parameters:
- Arithmetic Mean (μ)
- Standard Deviation (σ)
The capability index is then calculated by measuring the distance between the process mean and the specification limits, divided by three standard deviations.
This method has been widely used for decades because it works very well when the process data is approximately normal.
However, modern manufacturing is rarely that simple.
Many quality characteristics naturally produce data that is skewed, truncated, or otherwise non-normal.
Typical examples include:
- Flatness
- Roundness
- Circularity
- Position tolerance
- Surface roughness
- One-sided tolerance characteristics
- Dimensions affected by progressive tool wear
When these data are forced into a normal-distribution model, the estimated standard deviation may no longer represent the true spread of the process.
As a result, the calculated Cpk can become overly conservative—or sometimes even misleading.
Cpk.g Uses the Actual Distribution of the Data
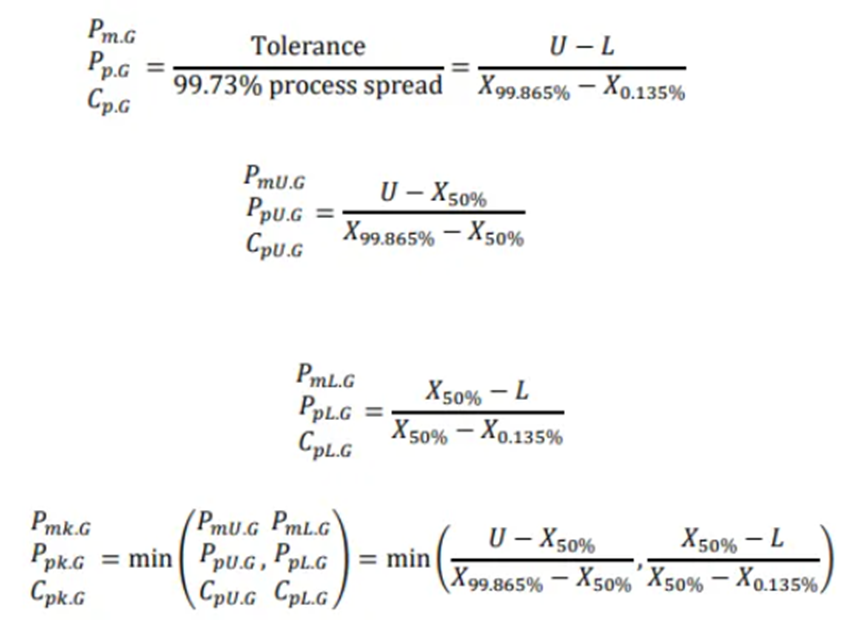
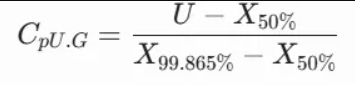
Instead of estimating process capability from the mean and standard deviation, Cpk.g evaluates the process directly from the empirical distribution of the collected data.
The AIAG-VDA SPC Manual adopts three key percentile values:
- 0.135th Percentile
- Median (50th Percentile)
- 99.865th Percentile
These three values correspond to the lower boundary, center, and upper boundary of the actual process distribution.
Unlike traditional statistical estimation, no assumption is made that the data must follow a perfect bell-shaped curve.
In other words, the data is allowed to describe itself.
This is the fundamental philosophy behind Cpk.g.
Why Are These Percentiles Selected?
Many engineers notice the unusual percentile values immediately.
Why 0.135% and 99.865%?
The reason is straightforward.
For a perfectly normal distribution,
approximately 99.73% of all observations fall within ±3σ of the mean.
The lower boundary of that interval corresponds to approximately the 0.135th percentile, while the upper boundary corresponds to approximately the 99.865th percentile.
Therefore, for normally distributed data,
the percentile-based method produces results that are very close to the traditional ±3σ approach.
However, once the data becomes non-normal,
the percentile method continues to represent the true process spread,
while the standard deviation method may gradually lose accuracy.
Why Is Cpk.g Better for Non-Normal Data?
Imagine a machining process where tool wear causes the measured dimension to increase gradually over time.
The resulting distribution is no longer symmetric.
Instead, it develops a long tail toward one specification limit.
Traditional Cpk still attempts to summarize this process using only the mean and standard deviation.
Unfortunately, these two statistics cannot fully describe a skewed distribution.
Cpk.g approaches the problem differently.
Rather than trying to fit the data into a normal-distribution model, it measures the actual lower and upper boundaries directly from the observed production data.
As a result,
the capability evaluation reflects what is truly happening on the shop floor,
rather than what the mathematical assumptions expect the data to look like.
For this reason, Cpk.g is particularly well suited for manufacturing processes involving:
- One-sided tolerances
- Skewed distributions
- Long-tailed distributions
- Progressive tool wear
- Naturally non-normal process characteristics
Does This Mean Traditional Cpk Is Obsolete?
Absolutely not.
Traditional Cpk remains the preferred capability index whenever the process data satisfies the assumptions of normal distribution and statistical control.
Cpk.g is not a replacement for Cpk.
Instead, it provides an additional capability evaluation method for situations where traditional assumptions are no longer appropriate.
Rather than choosing one over the other, modern SPC software should allow engineers to evaluate both indices and select the most appropriate interpretation based on the characteristics of the manufacturing process.
3. Why Does the AIAG-VDA SPC Manual State That Cpk.g = Ppk.g?
Many quality engineers are surprised when they first encounter Cpk.g in the new AIAG-VDA SPC Manual.
One question comes up almost immediately:
If traditional SPC distinguishes between Cpk and Ppk, why does the manual state that Cpk.g and Ppk.g are calculated using exactly the same method?

At first glance, this seems contradictory.
However, the answer becomes clear once we understand the philosophy behind the new capability index.
Traditional Cpk and Ppk Use Different Estimates of Process Variation
In conventional SPC, the distinction between Cpk and Ppk comes from the way process variation is estimated.
Cpk uses the within-subgroup standard deviation, which reflects short-term process variation under statistically controlled conditions.
Ppk, on the other hand, uses the overall standard deviation of all collected data, representing long-term process performance.
Although both indices use similar capability formulas, they are based on different estimates of variation.
This is why their values often differ.
Cpk.g No Longer Relies on Standard Deviation
Cpk.g follows a completely different approach.
Instead of estimating variation through standard deviation, it measures capability directly from the empirical percentiles of the data.
Since both Cpk.g and Ppk.g are calculated from exactly the same percentile values, there is no longer a mathematical difference between the two calculations.
The formula remains identical.
So why do both names still exist?
The answer lies in process status, not in mathematics.
The Difference Is the Process, Not the Formula
The AIAG-VDA SPC Manual continues to distinguish between C and P, but no longer because they use different statistical calculations.
Instead, the distinction reflects whether the manufacturing process is operating under statistical control.
If the process has been verified as stable and statistically controlled, the capability index is reported as Cpk.g.
If the process has not yet been confirmed to be stable—or if special-cause variation is still present—the exact same calculation is reported as Ppk.g.
In other words:
- Stable and controlled process → Cpk.g
- Unstable or unverified process → Ppk.g
The calculation does not change.
Only the interpretation changes.
Why Is This Important?
This change reinforces one of the fundamental principles of SPC.
A capability index should never be interpreted without first understanding the condition of the process.
Two manufacturing lines may produce exactly the same percentile values.
If one process is statistically stable and the other is not, they should not be described using the same capability terminology.
By keeping separate names for Cpk.g and Ppk.g, the AIAG-VDA methodology reminds engineers that process stability must always be evaluated before process capability.
The capability number alone is not enough.
Avoid the Common Misunderstanding
Some engineers mistakenly assume that because Cpk.g and Ppk.g are calculated using the same formula, they are interchangeable.
This is not the intended interpretation.
The identical calculation simply reflects the fact that both indices use percentile-based estimation rather than standard deviation.
Whether the result is reported as Cpk.g or Ppk.g still depends entirely on the statistical condition of the manufacturing process.
The capability index answers how capable the process is.
SPC control charts determine whether the process is capable of being evaluated as a stable process in the first place.
These two assessments should always be considered together.
Key Takeaway
The introduction of Cpk.g does not eliminate the importance of SPC control charts.
On the contrary, it reinforces them.
Before selecting the appropriate capability index, engineers should first determine whether the process is statistically stable.
Only then can they decide whether the capability result should be interpreted as Cpk.g or Ppk.g.
The formula may be identical—
but the meaning behind the result is fundamentally different.
4. Why Does Cpk.g Require at Least 125 Data Points?
After learning how Cpk.g works, many engineers ask another practical question:
Can I calculate Cpk.g with only 30 or 50 samples?
The answer is:
Technically, yes. Statistically, no.
The AIAG-VDA SPC Manual recommends using at least 125 observations before calculating Cpk.g.
This recommendation is not arbitrary—it is based on the statistical characteristics of percentile estimation.
Percentiles Depend on Sufficient Sample Size
Unlike the arithmetic mean, percentile values are estimated directly from the ordered data.
The fewer observations available, the less reliable these percentile estimates become.
For example, imagine trying to estimate the 0.135th percentile from only 30 measurements.
In reality, there are simply not enough data points to accurately determine where this extreme percentile lies.
As a result, the calculated process capability may fluctuate significantly with each new sample, even if the manufacturing process itself has not changed.
The capability index becomes unstable—not because the process is unstable, but because the statistical estimate is unreliable.
More Data Means More Reliable Capability Evaluation
As the sample size increases, percentile estimates become progressively more stable.
The estimated lower boundary, median, and upper boundary gradually converge toward the true characteristics of the manufacturing process.
This is why the AIAG-VDA SPC Manual recommends collecting a minimum of 125 observations before performing Cpk.g capability analysis.
With sufficient data, the percentile-based approach can accurately describe the actual process distribution and provide a much more reliable capability evaluation.
When Should Traditional Cpk Be Used Instead?
If your process data is approximately normally distributed and only a limited number of observations are available, traditional Cpk remains the more appropriate choice.
Attempting to calculate Cpk.g with an insufficient sample size does not improve the analysis.
Instead, it may produce capability values that are heavily influenced by random sampling variation.
In other words, the result becomes more like guesswork than statistical evaluation.
For small datasets, it is generally better to use the traditional capability indices—provided the assumptions of normality and statistical control are satisfied.
5. Conclusion: Don't Become a Slave to Capability Numbers
In practice, engineers often spend too much time debating which capability index is "better."
The real objective, however, is not to produce a more attractive report.
It is to understand the true health of the manufacturing process.
Whether you use Cpk, Ppk, Cpk.g, or Ppk.g, these indices are simply diagnostic tools.
Like a medical examination, they help reveal the condition of the process—but they are not the process itself.
Some engineers dismiss capability indices as nothing more than "numbers."
In reality, the numbers are not the problem.
The real mistake is applying a statistical method without first confirming that its assumptions are appropriate for the data.
Choosing the right capability index is far more important than chasing a higher capability value.
Key Takeaways
Before concluding, let's summarize the most important concepts.
- Don't define Cpk and Ppk by "short-term" and "long-term."
A statistically stable and controlled process should be evaluated using the C-series capability indices, while an unstable or uncontrolled process should use the P-series indices. - The essence of Cpk.g is percentile-based capability analysis.
Instead of relying on the arithmetic mean and standard deviation, Cpk.g evaluates process capability directly from the actual data distribution using the median and extreme percentiles. - Cpk.g and Ppk.g share the same calculation method.
The difference lies not in the formula, but in whether the manufacturing process has been demonstrated to be statistically stable. - Sample size matters.
Without at least 125 observations, percentile estimates become unreliable, and Cpk.g should generally not be used.
Let Software Handle the Calculations—So Engineers Can Focus on Quality
As manufacturing processes become increasingly complex, manually calculating capability indices in spreadsheets is no longer an efficient approach.
Modern web-based SPC software can automatically:
- Detect process abnormalities
- Perform capability analysis
- Calculate Cpk, Ppk, Cpk.g, and Ppk.g
- Generate SPC charts automatically
- Monitor production in real time
- Issue intelligent alarm notifications
Instead of spending valuable engineering time on repetitive calculations, quality teams can focus on what truly matters—
understanding the manufacturing process, solving quality problems, and continuously improving process capability.
With NexSPC, advanced statistical analysis becomes part of your everyday quality management workflow, helping manufacturers make faster, more accurate, and more confident process decisions.