














Quality engineers know the frustration all too well.
Flatness, roundness, and many other manufacturing characteristics are naturally non-normal because of one-sided tolerances. Mold wear often creates long-tailed distributions over time. Yet many traditional SPC systems continue to apply classical capability formulas based on the assumption of normal distribution, resulting in misleadingly low Cpk values.
To satisfy customer audits, engineers have often relied on Box-Cox transformations or manually removed so-called "outliers" simply to force the data into a normal distribution. While these approaches may improve statistical results, they do not change the actual manufacturing process.
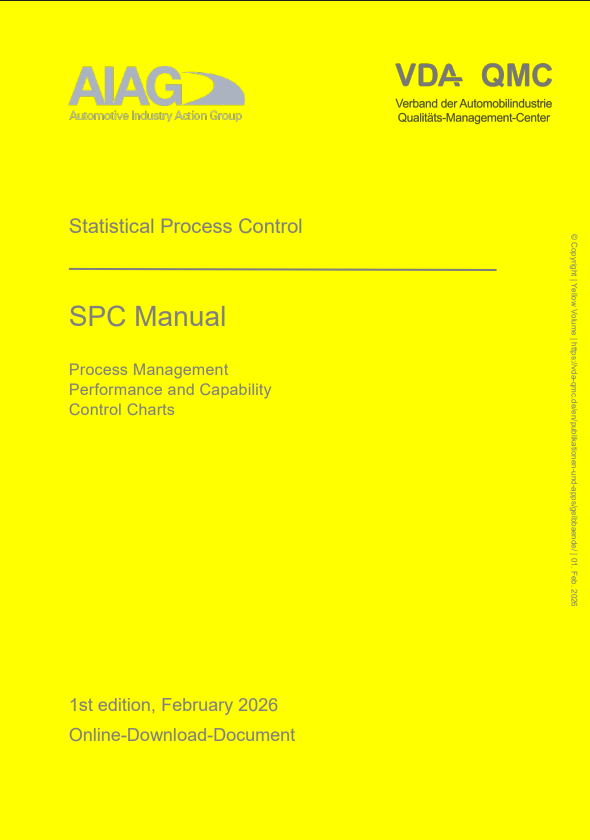
The upcoming AIAG-VDA SPC Manual (2026 Edition) officially introduces Cpk.g (Quantile-Based Process Capability Analysis) for non-normal data and the ABCD Time-Dependency Model for evaluating process time structures.
As one of the first enterprise-grade web-based SPC platforms aligned with the new 2026 guidelines, NexSPC provides a completely new approach to analyzing manufacturing data and improving process capability evaluation.
1. Move Beyond Rigid SPC Rules and Return to Real Manufacturing Processes
Before discussing advanced statistical analysis, let's start with the foundation—data collection and process monitoring.
Many traditional SPC systems require fixed subgroup sizes, such as five samples per subgroup. In real production environments, however, maintaining fixed subgroup sizes is often impractical.
NexSPC natively supports Variable Subgroup Size Control Charts, allowing the system to automatically select the appropriate control chart regardless of how the data is collected, whether through:
- Manual data entry
- Excel import
- MQTT data acquisition
- OPC machine connectivity
- Direct equipment integration
The system adapts to real manufacturing processes rather than forcing production to conform to software limitations.
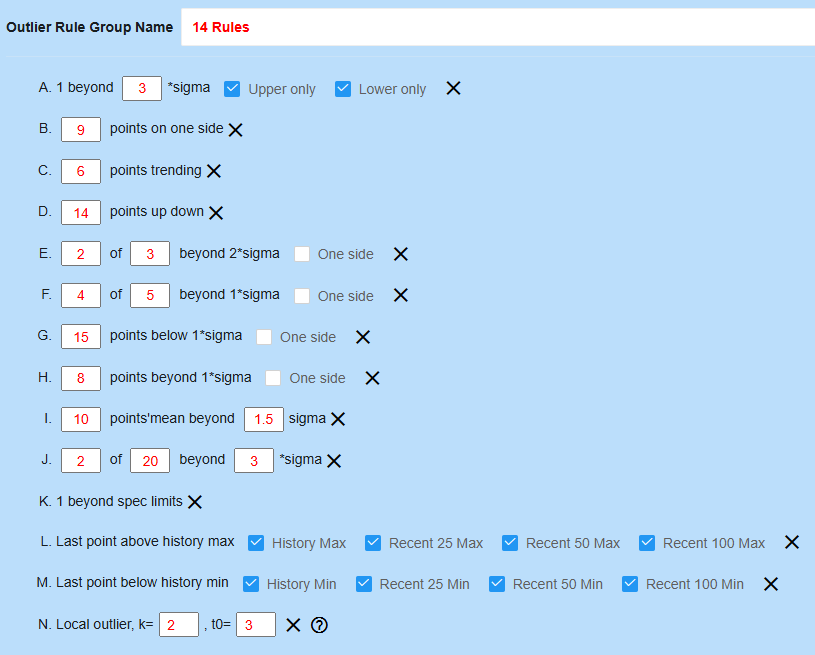
Smarter Alarm Rules for Modern Manufacturing
In addition to the traditional Western Electric SPC Rules, NexSPC introduces Sliding Window Maximum & Minimum Detection, designed specifically for high-speed manufacturing environments.
Instead of simply comparing new measurements with fixed control limits, the system temporarily excludes the latest data point and calculates the maximum and minimum values within the previous 25, 50, or 100 samples.
If the latest measurement exceeds this dynamic historical range, an alarm is triggered immediately.
This approach is significantly more sensitive to events such as:
- Sudden tool breakage during CNC machining
- Short-term fluctuations in chemical processes
- Unexpected process shifts in automated production lines
Compared with conventional control limits, dynamic sliding-window monitoring enables earlier detection of abnormal process behavior.
2. Traditional Cpk and Cpk.g: Complementary Rather Than Competitive
For normally distributed processes, NexSPC fully supports the traditional capability indices:
- Cp / Cpk
- Pp / Ppk
along with all standard statistical calculations.
But modern manufacturing increasingly encounters non-normal data.
To address this challenge, NexSPC fully implements Cpk.g / Ppk.g in accordance with the AIAG-VDA SPC Manual (2026 Edition).
Unlike traditional capability indices based on the process mean and standard deviation, Cpk.g uses empirical quantiles—including the median, X₀.₁₃₅%, and X₉₉.₈₆₅%—to estimate the actual process spread.
Whether the data exhibits skewness, long tails, or multiple peaks, Cpk.g evaluates the process based on the true distribution of the data, providing a more robust capability assessment.
Cpk and Cpk.g Are Designed to Work Together
A common misconception is that once Cpk.g becomes available, traditional Cpk should be abandoned.
This is not the philosophy behind NexSPC.
Instead of forcing users to choose one method, NexSPC calculates and displays both traditional Cpk/Ppk and Cpk.g/Ppk.g simultaneously.
This dual-track approach provides valuable engineering insight.
For example:
- Traditional Cpk = 0.80
- Cpk.g = 1.50
Rather than indicating conflicting results, the system tells engineers something important:
Your manufacturing process may actually be capable. The poor traditional Cpk is likely caused by the non-normal distribution of the data rather than poor process performance.
This side-by-side comparison provides far more meaningful engineering guidance than simply forcing data into a normal distribution.
3. ABCD Time-Dependency Model: Understanding the Time Structure of Process Variation
If Cpk answers the question,
"Is the product capable?"
then the ABCD Time-Dependency Model answers a different question:
"What is happening inside the manufacturing process over time?"
NexSPC automatically performs ABCD Time-Dependency Classification for every monitored process.
Typical classifications include:
A1 / A2
The process is statistically stable and operating under ideal control conditions.
C3
The system detects a significant process trend.
In many machining applications, this often indicates progressive tool wear over time.
C4
A step change has occurred within the process.
Possible causes include:
- Material batch replacement
- Operator shift changes
- Equipment adjustments
- Process setup modifications
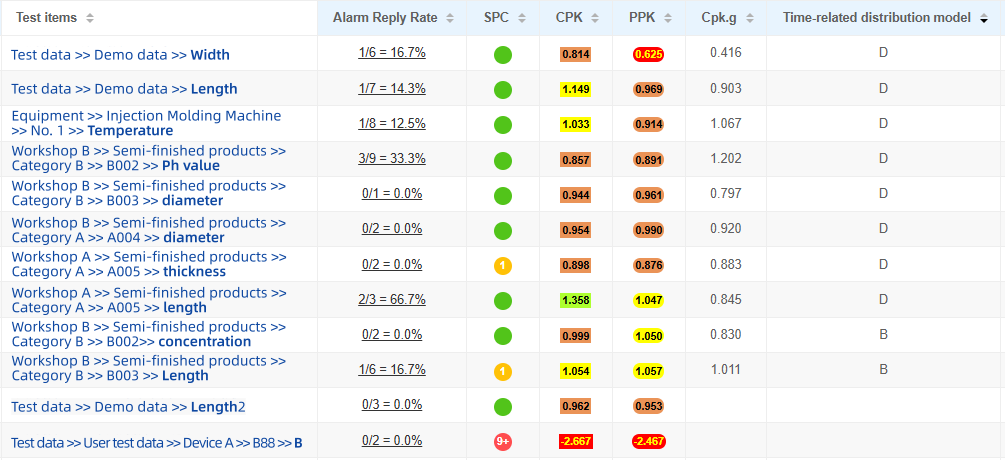
Rather than restricting data analysis, ABCD classifications serve as supplementary diagnostic information, helping engineers optimize tooling schedules, process parameters, and preventive maintenance.
4. Can't Find the Root Cause? Try Advanced Frequency Analysis
Sometimes the control chart reports an abnormal condition, yet engineers cannot identify the cause after investigating the traditional 5M1E factors.
In many cases, the true cause is hidden inside periodic process variation.
NexSPC integrates both:
- ACF (Autocorrelation Function) Analysis
- FFT (Fast Fourier Transform) Spectrum Analysis
within the single-variable analysis page.
With just one click, engineers can transform complex process signals into meaningful frequency-domain information.
High-frequency equipment vibration...
Low-frequency thermal drift caused by day-night temperature variation...
Periodic machine resonance...
These hidden process characteristics become immediately visible in the frequency spectrum.
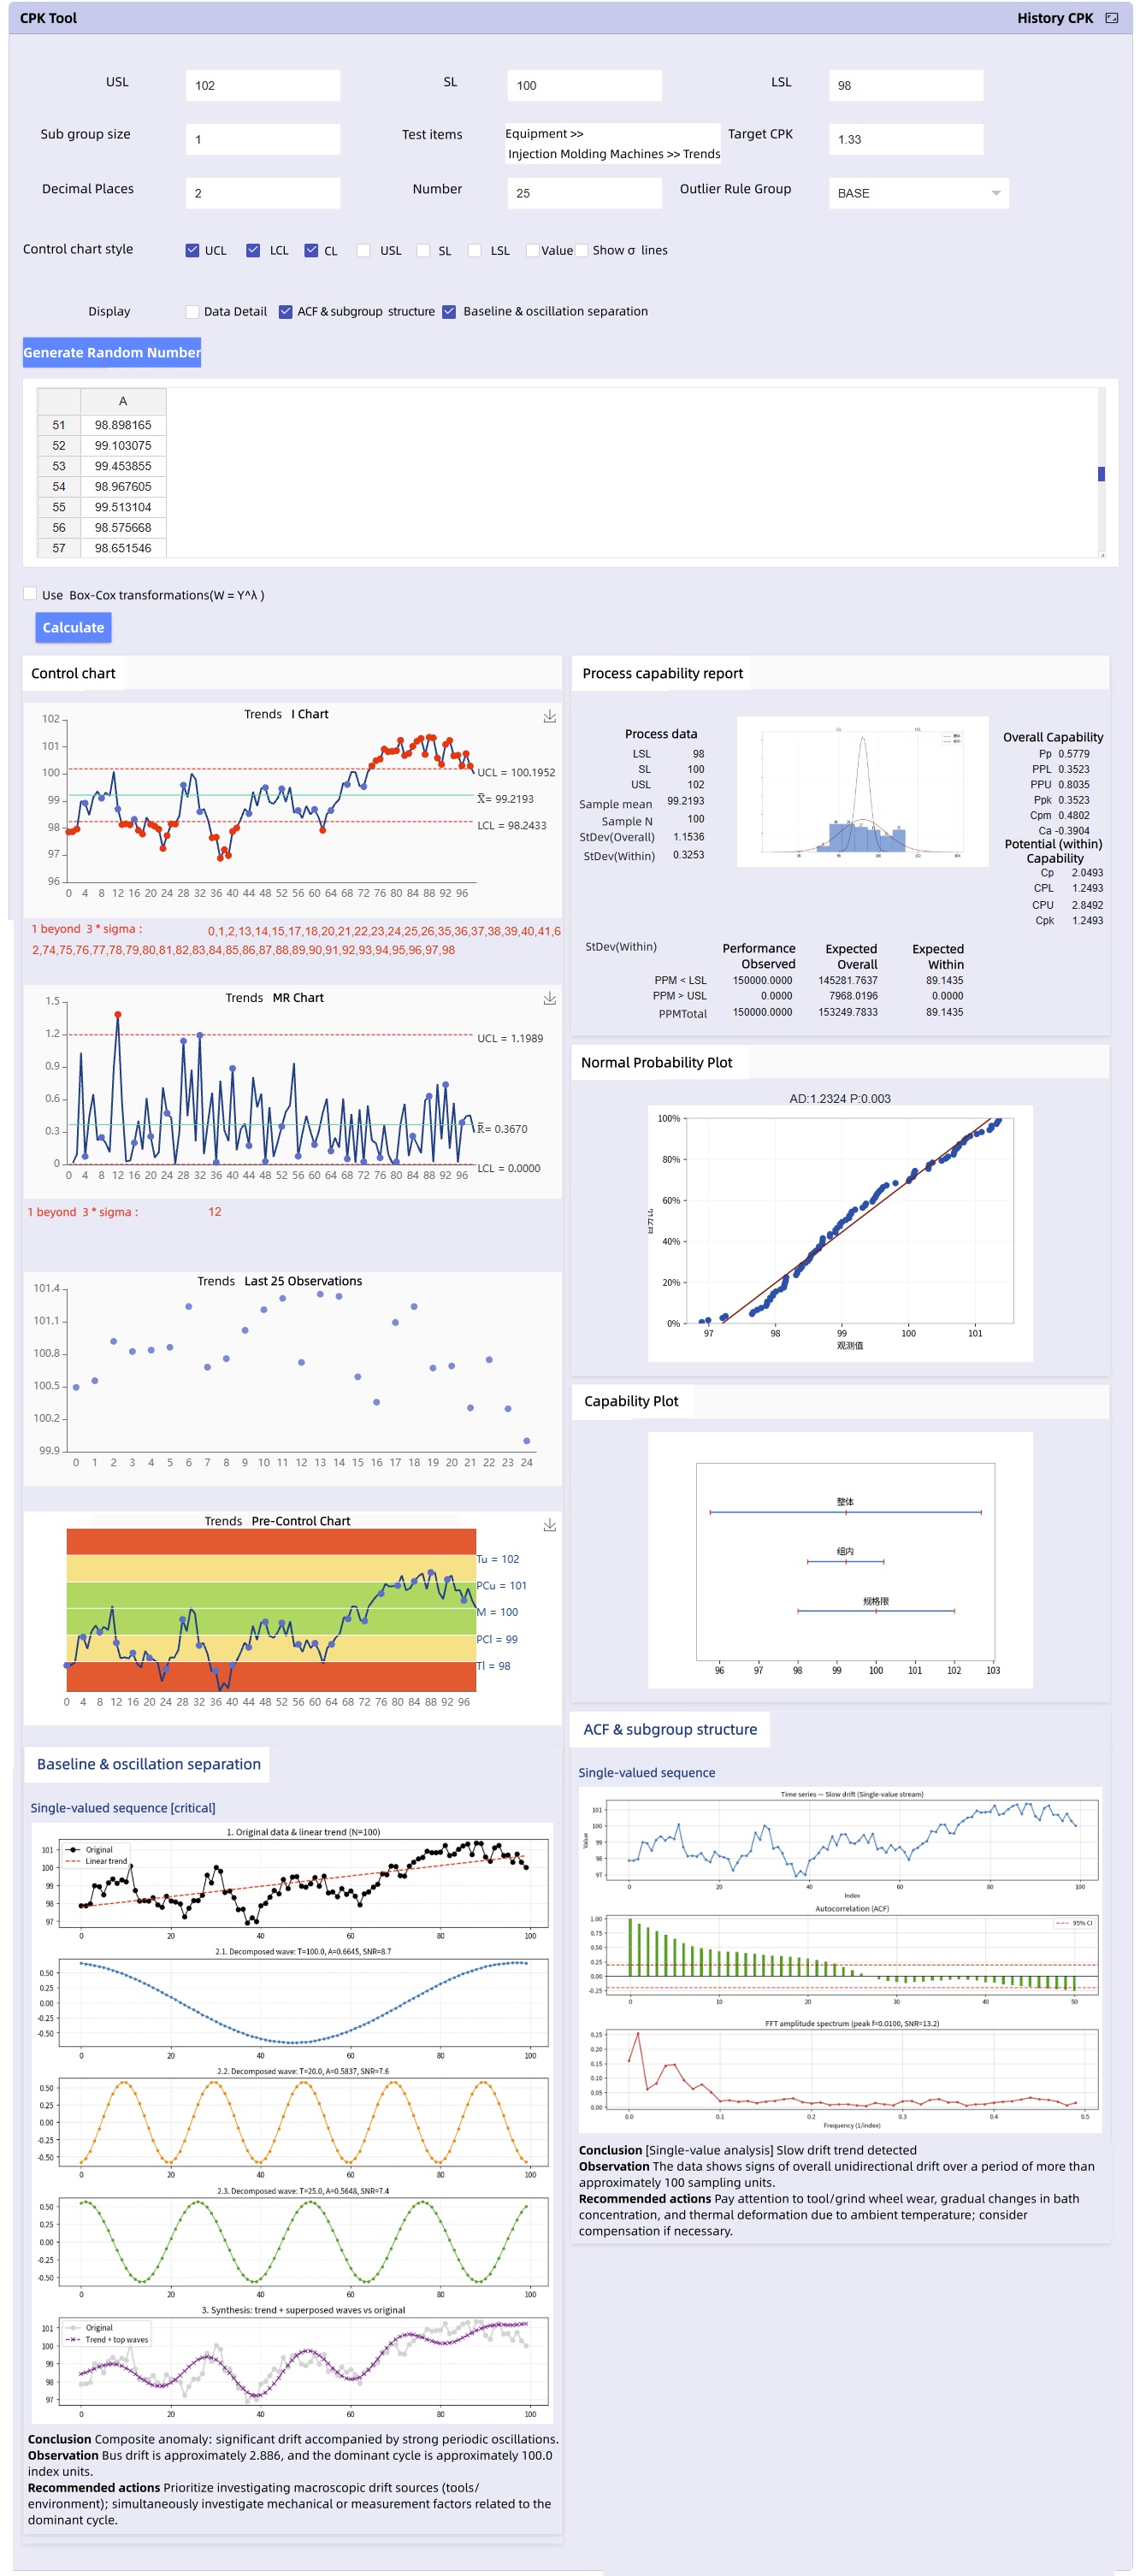
Combined with Baseline & Oscillation Separation Technology, NexSPC automatically evaluates the severity of abnormal signals and provides corresponding diagnostic recommendations.
5. Built-in Engineering Statistics and Flexible Dashboards
As a complete enterprise SPC platform, NexSPC also includes a comprehensive suite of engineering statistical tools, including:
- Measurement System Analysis (MSA)
- Crossed Gage R&R
- Nested Gage R&R
- Attribute Agreement Analysis
- Analysis of Variance (ANOVA)
- Regression Analysis
- Other engineering statistical tools
These capabilities are provided as standard modules within the platform.
NexSPC also supports a wide range of dashboard types, including:
- Animated Dashboards
- Card-Based Dashboards
- Statistical Dashboards
- Large-Screen Production Dashboards
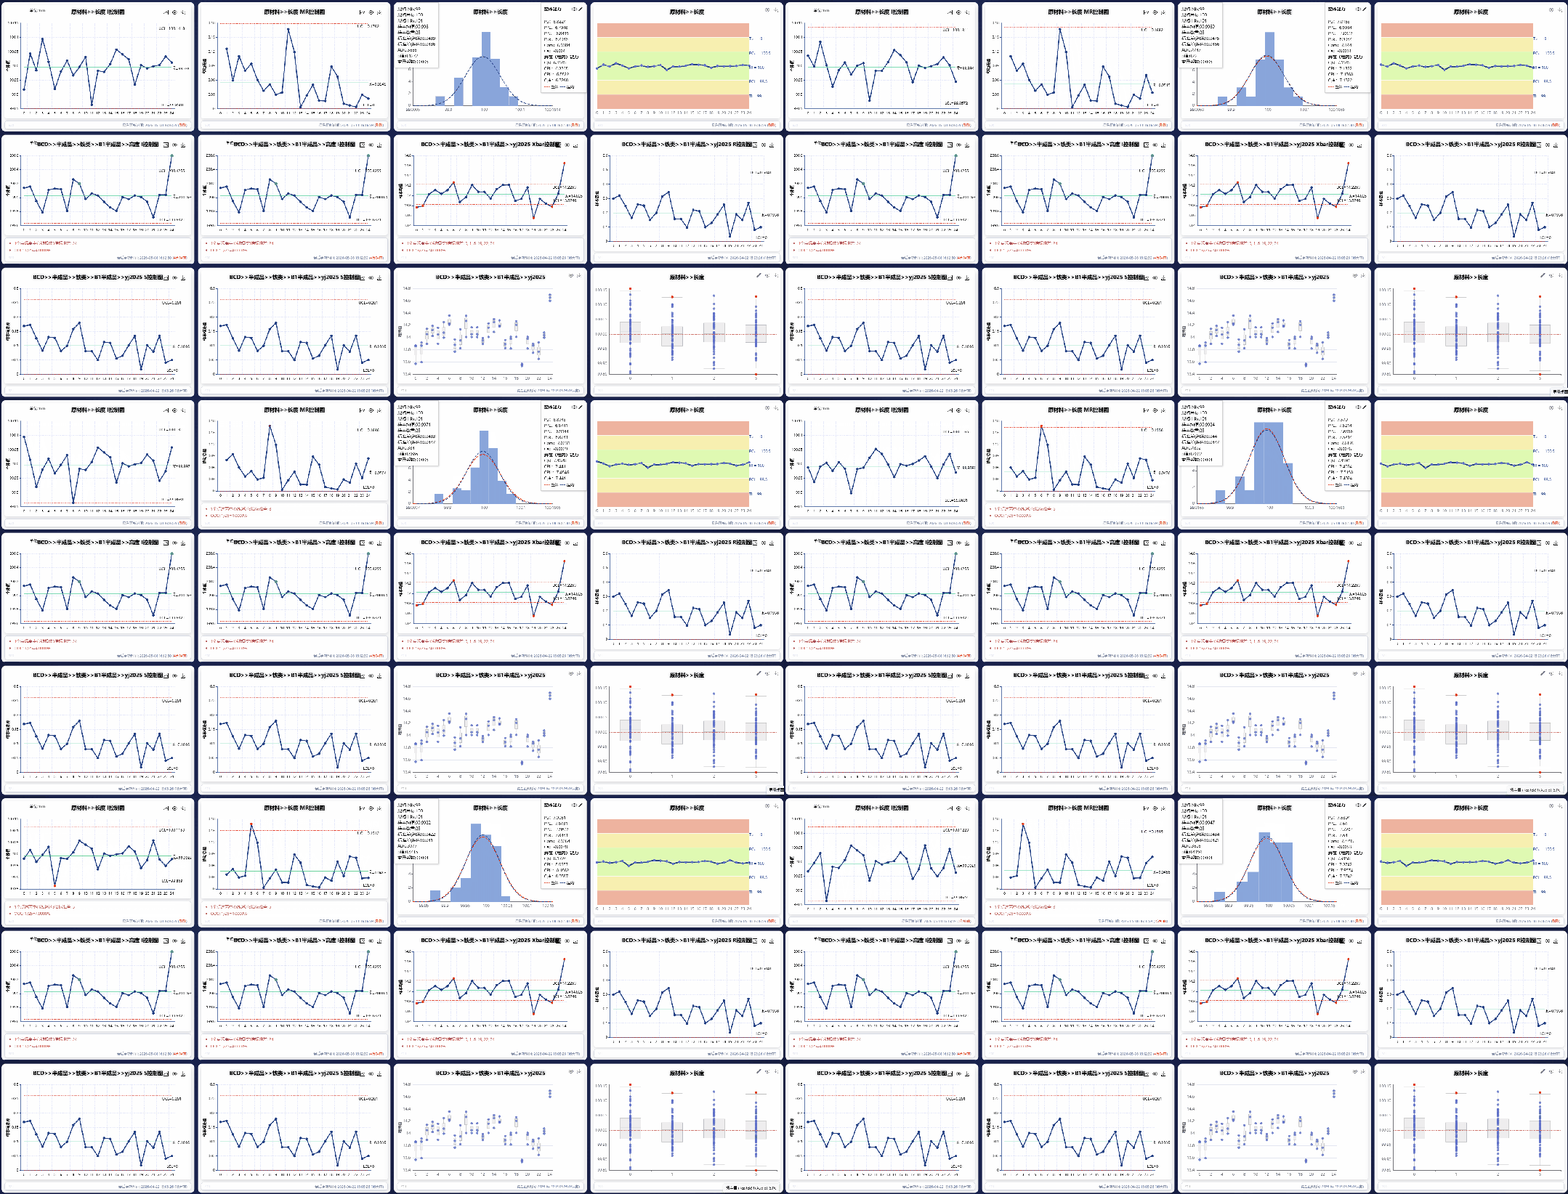
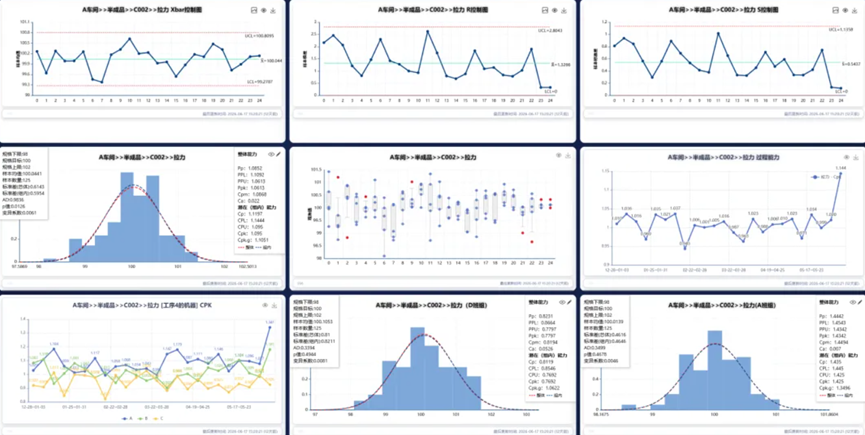
allowing manufacturers to visualize quality data in the way that best fits their production environment.
6. Intelligent Monitoring and Alarm Notifications
No quality engineer can spend an entire day watching control charts.
NexSPC's intelligent monitoring engine allows different monitoring strategies for different production stages.
For example, manufacturers can configure different capability thresholds and calculation windows for:
- PPAP Trial Production
- Mass Production
including independent alarm settings for:
- Cpk
- Ppk
- Cpk.g
- Ppk.g
The default Cpk.g evaluation window uses the most recent 125 samples, while all thresholds remain fully configurable.
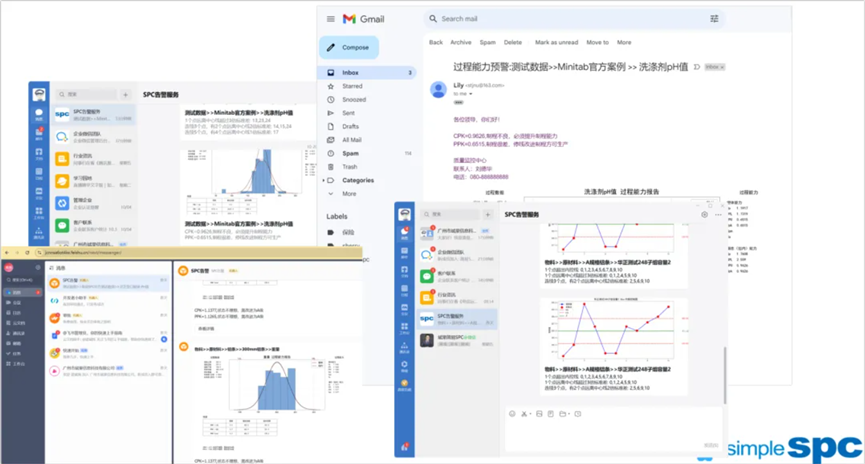
Whenever an abnormal condition occurs, NexSPC automatically captures screenshots, generates event summaries, and immediately sends notifications through:
- WeCom
- Feishu
- MQTT Messaging
ensuring engineers receive critical process information without constantly monitoring dashboards.
Conclusion
A modern SPC platform should be far more than a tool for generating control charts during customer audits.
It should help engineers discover abnormalities, explain process behavior, identify root causes, and continuously improve manufacturing performance.
From automatic data collection and real-time OOC monitoring to dual-track capability analysis with Cpk.g and the ABCD Time-Dependency Model aligned with the AIAG-VDA SPC Manual (2026 Edition), NexSPC delivers a complete enterprise-grade SPC solution built for modern manufacturing.
If you're ready to move beyond misleading statistical assumptions and embrace a new generation of process capability analysis, it's time to experience what NexSPC can do.