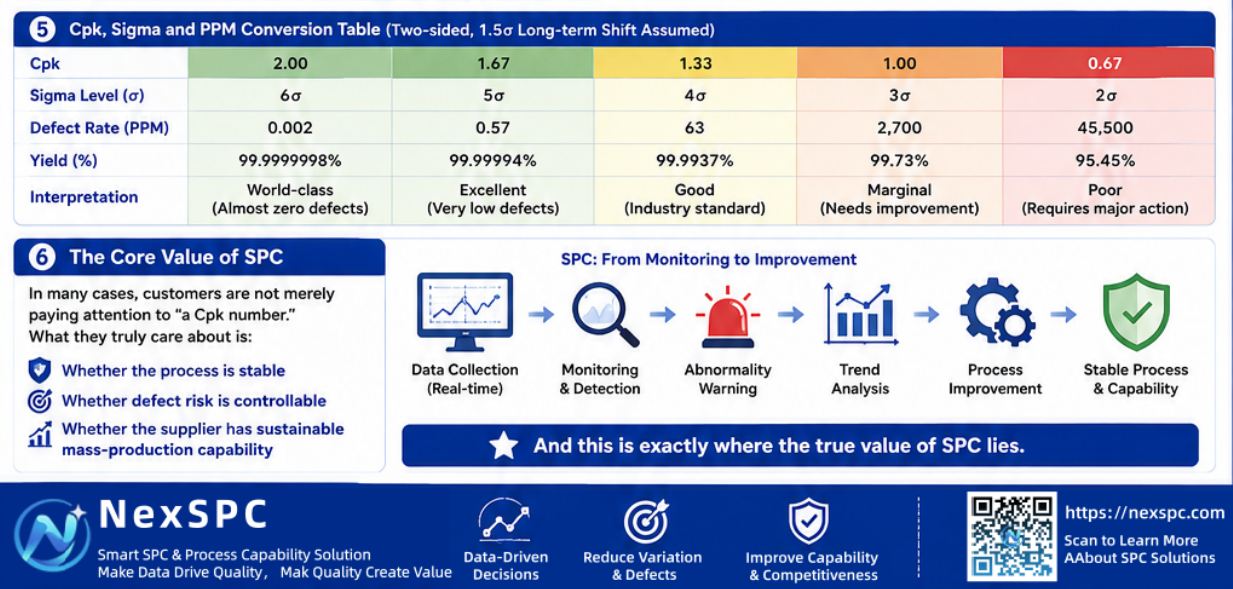














Many Quality Professionals Still Don’t Fully Understand It
In SPC and process quality management, several classic indicators are frequently discussed:
- Cpk
- Sigma Level (σ)
- PPM (Defect Rate)
However, many people only “read the numbers” without truly understanding the relationship behind them.
In reality:
Cpk measures the capability of a process to meet specification limits, while Sigma level and PPM describe process variation and defect risk.
These three indicators are essentially different ways of expressing the same process capability concept.
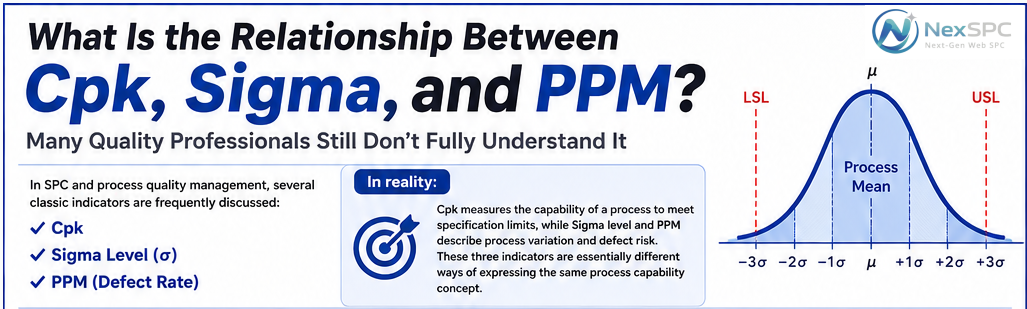
1. Why Do Customers Often Require Cpk ≥ 1.33?
Because different Cpk levels correspond to dramatically different defect rates.
| Cpk | Approx. Sigma Level | Defect Rate (PPM) |
|---|---|---|
| 1.00 | 3σ | \~2700 ppm |
| 1.33 | 4σ | \~63 ppm |
| 1.67 | 5σ | \~0.57 ppm |
This means:
When Cpk improves from 1.00 to 1.33,
the defect rate drops significantly from approximately 2700 ppm to around 63 ppm.
That is why:
Cpk = 1.33 gradually became the standard mass-production capability threshold across the manufacturing industry.
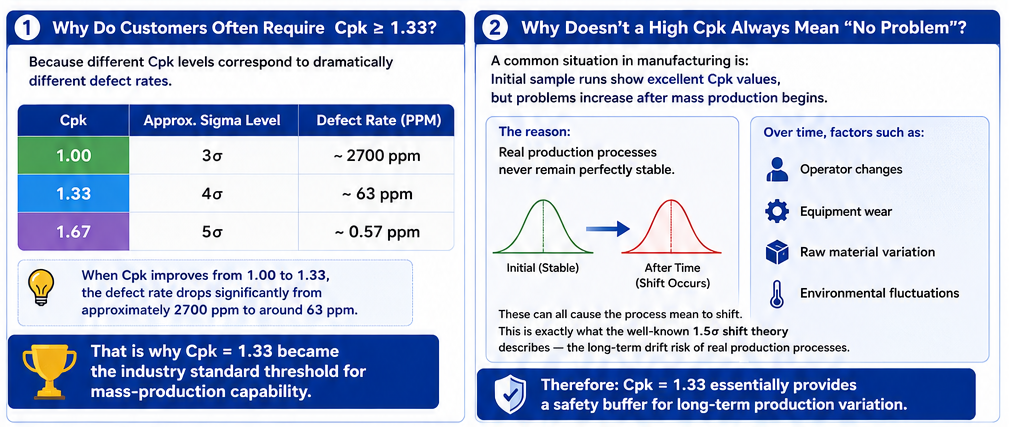
2. Why Doesn’t a High Cpk Always Mean “No Problem”?
A common situation in manufacturing is:
- Initial sample runs show excellent Cpk values
- But problems increase after mass production begins
The reason is simple:
Real production processes never remain perfectly stable forever.
Over time, factors such as:
- Operator changes
- Equipment wear
- Raw material variation
- Environmental fluctuations
can all cause the process mean to shift.
This is exactly what the well-known 1.5σ shift theory describes — the long-term drift risk of real production processes.
Therefore:
Cpk = 1.33 essentially provides a safety buffer for long-term production variation.
3. Why Is SPC So Important?
Because:
Cpk is only a result.
SPC is the method used to maintain process stability continuously.
Without continuous monitoring:
- Even if the initial capability is qualified
- The process may gradually drift out of control over time
Therefore, mature quality management is not simply:
דPerforming a one-time capability study”
Instead, it requires:
- Continuous monitoring
- Abnormality warning
- Trend analysis
- Process improvement
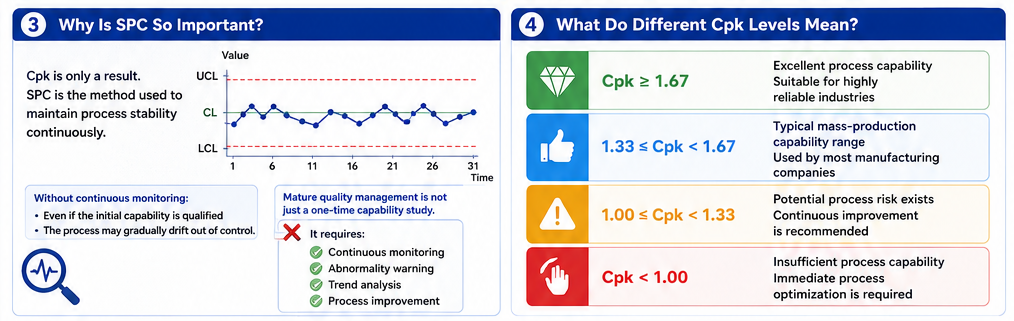
4. What Do Different Cpk Levels Mean?
Cpk ≥ 1.67
Excellent process capability
Suitable for highly reliable industries
1.33 ≤ Cpk < 1.67
Typical mass-production capability range
Used by most manufacturing companies
1.00 ≤ Cpk < 1.33
Potential process risk exists
Continuous improvement is recommended
Cpk < 1.00
Insufficient process capability
Immediate process optimization is required
5. The Core Value of SPC
In many cases, customers are not merely paying attention to “a Cpk number.”
What they truly care about is:
- Whether the process is stable
- Whether defect risk is controllable
- Whether the supplier has sustainable mass-production capability
And this is exactly where the true value of SPC lies.