














For more than a decade, many manufacturers have viewed SPC as little more than drawing a few control charts.
They review X̄-R and I-MR charts every day, ask the production team to investigate when an alarm occurs, and export a Cpk report at the end of the month. It seems that the SPC task is complete.
But if this is still how you understand SPC today, your approach may already be falling behind the latest AIAG-VDA SPC Manual.
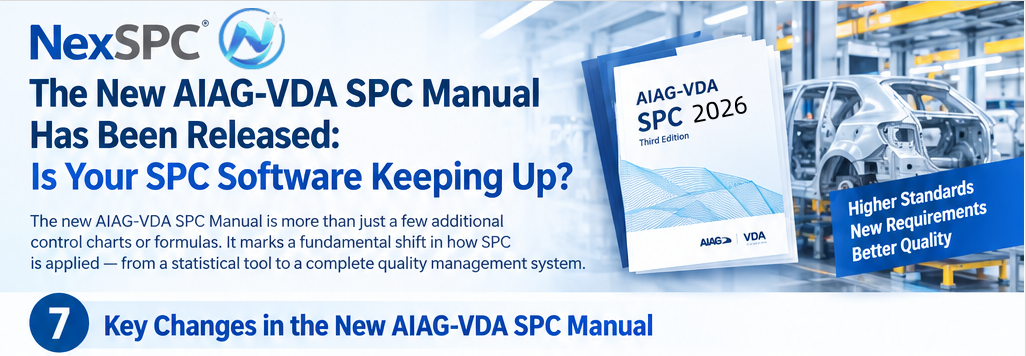
The new AIAG-VDA SPC Manual does more than introduce a few additional control charts or modify several formulas. It represents a broader evolution in the philosophy of SPC—from a statistical tool to an integral part of a comprehensive, end-to-end quality management system.
For manufacturers in automotive components, precision machining, electronics, semiconductors, medical devices, and other industries, this means that companies need to rethink not only their quality management practices but also whether their existing SPC software can meet the evolving requirements.
In this article, we highlight the key changes worth understanding in the new AIAG-VDA SPC Manual.
1. SPC Is No Longer Just About Drawing Control Charts
Many companies still operate in the following way:
- The Quality Department is responsible for SPC.
- The Production Department is responsible for manufacturing.
- When an abnormality occurs, a meeting is held to investigate it.
SPC is therefore treated as the responsibility of the Quality Department alone.
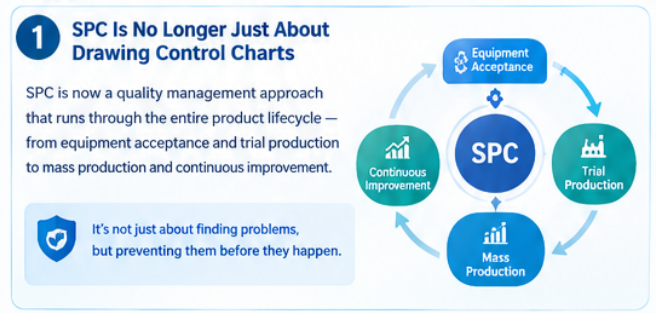
The new AIAG-VDA SPC Manual emphasizes that SPC is no longer simply a control chart. It is a quality management approach that extends throughout the entire product lifecycle.
From equipment acceptance and trial production to mass production and continuous improvement, statistical methods should be used at every stage to identify process variation and prevent quality risks—not merely to respond after an abnormality occurs.
Truly effective SPC does not just identify problems. It helps prevent them before they happen.
2. Cpk Can No Longer Be Calculated Without Proper Verification
Cpk is one of the most frequently reviewed metrics in manufacturing.
However, the new manual reinforces an issue that has long been overlooked:
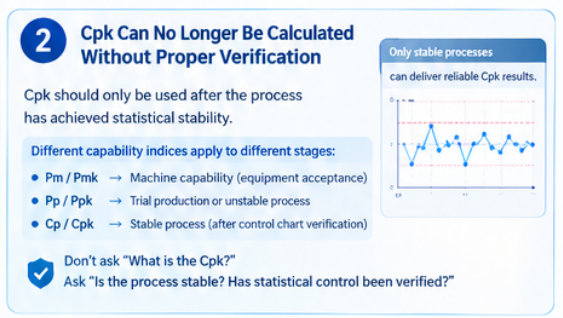
Cpk should not be used to evaluate process capability until statistical stability has been established.
In practice, we often see situations where:
- The control chart repeatedly signals out-of-control conditions.
- The process mean continues to drift.
- The data clearly shows instability.
Yet a seemingly impressive Cpk report is still generated.
Such a result may have little practical value for evaluating the predictive capability of an unstable process.
The new manual clarifies the application of several capability indices.
Pm / Pmk
Used for machine capability studies, primarily during equipment acceptance, to evaluate the precision of the machine itself.
Pp / Ppk
Used during trial production or when the process has not yet been established as stable, providing an assessment of actual production performance.
Cp / Cpk
Used to evaluate process capability after control charts have verified that the process is statistically stable and under control.
Therefore, when reviewing a capability analysis report, the first question should not be:
"What is the Cpk?"
Instead, ask:
"Is the process stable? Has its statistical control been verified?"
Only Cpk calculated under appropriate, verified process conditions can provide meaningful guidance for predicting process capability.
3. Non-Normal Data Finally Has a Standardized Approach
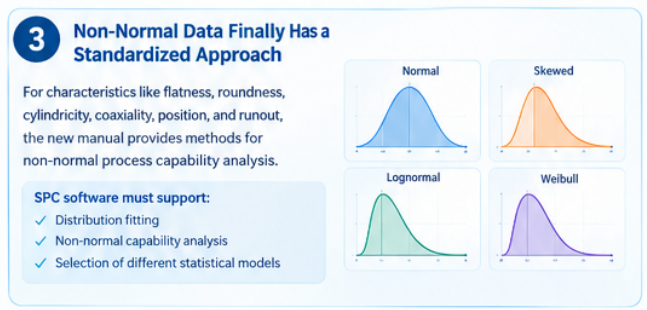
In precision machining, many measured characteristics do not naturally follow a normal distribution.
Examples include:
- Flatness
- Roundness
- Cylindricity
- Coaxiality
- Position
- Runout and other geometrical tolerances
In the past, many manufacturers simply applied normal-distribution formulas to calculate Cpk for these characteristics.
The result could be a seemingly favorable capability index that failed to represent the actual product quality risk.
The new AIAG-VDA SPC Manual provides methods for analyzing the capability of non-normal processes.
This means manufacturers can no longer assume that all production data should be evaluated using a normal-distribution model.
SPC software must therefore support:
- Distribution fitting
- Non-normal process capability analysis
- Selection of different statistical models
Without these capabilities, analysis results may be significantly misleading.
4. Additional Control Charts Enable More Precise Monitoring of Specialized Processes
Historically, the control charts most commonly used by manufacturers have included:
- X̄-R charts
- X̄-S charts
- I-MR charts
- P charts
- NP charts
- C charts
- U charts
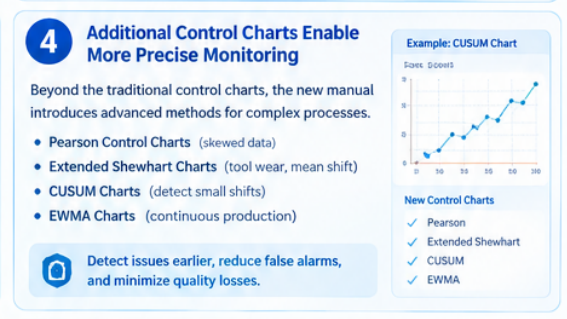
To address more complex manufacturing scenarios, the new manual introduces additional analytical methods, including the following.
Pearson Control Charts
Suitable for specialized data patterns, including skewed distributions.
Extended Shewhart Control Charts
Designed for processes involving conditions such as tool wear and continuous shifts in the process mean, helping reduce false alarms.
CUSUM Control Charts
Designed to detect small process shifts quickly, often identifying changes in process trends earlier than traditional control charts.
EWMA Control Charts
By assigning greater weight to more recent observations, EWMA charts are particularly suitable for monitoring continuous production processes.
For high-precision manufacturing, these additional control chart methods can help companies identify abnormalities earlier and reduce quality losses.
5. Insufficient Sample Sizes Mean Greater Uncertainty in Capability Results
Many manufacturers assume that once a capability index has been calculated, they can determine whether a process is capable.
The new manual highlights an important consideration:
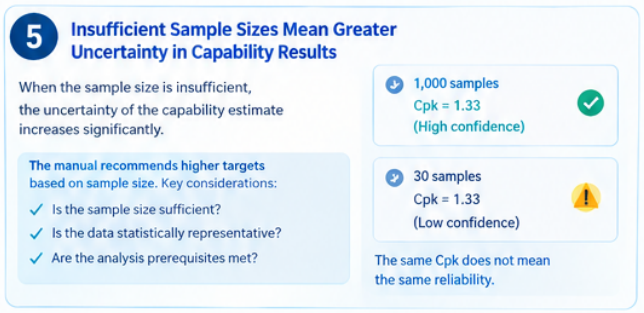
When the sample size is insufficient, the uncertainty of the capability estimate increases significantly.
Consider two studies that both report Cpk = 1.33.
One result is based on 1,000 observations, while the other is based on just 30 observations.
The two estimates do not necessarily have the same level of statistical confidence.
The new manual therefore introduces more stringent capability target considerations based on sample size.
When conducting SPC analysis, manufacturers need to consider more than the capability index itself:
- Is the sample size sufficient?
- Is the data statistically representative?
- Are the prerequisites for the selected analysis method satisfied?
A capability index should always be interpreted in the context of the data supporting it.
6. Why Does Your SPC System Keep Triggering Alarms?
Many manufacturers have experienced this frustrating situation.
The system triggers an alarm yesterday.
It triggers another alarm today.
The equipment has already been repaired, and the cutting tool has been replaced, but the control chart continues to signal abnormalities.
Is the SPC software really the problem?
Not necessarily.
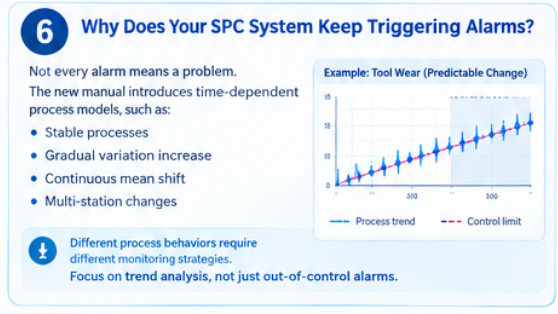
The new AIAG-VDA SPC Manual introduces time-dependent process models that classify manufacturing processes into different types, such as:
- Stable processes
- Processes with gradually increasing variation
- Processes with continuous shifts in the mean
- Processes exhibiting variation caused by changes between workstations
Different process behaviors require different monitoring strategies.
For example, progressive tool wear is not necessarily an unexpected abnormality. It can be a predictable change in the manufacturing process.
If a traditional fixed-control-limit approach is used without considering this behavior, it may generate a large number of false alarms.
This is why an increasing number of manufacturers are paying attention to trend analysis, rather than relying solely on out-of-control alarms.
Understanding how a process changes over time is essential to distinguishing expected process behavior from genuine abnormalities.
7. The New SPC Manual Sets Higher Expectations for Software
In the past, SPC software that could generate control charts was often considered sufficient.
Today, the new AIAG-VDA SPC Manual points toward more comprehensive software capabilities.
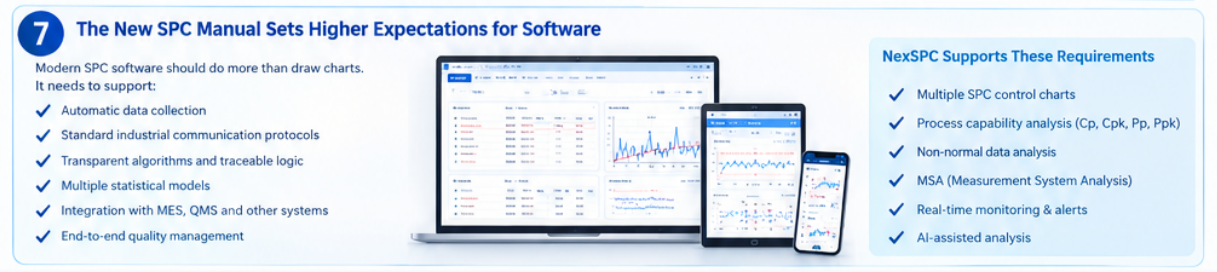
A capable SPC platform should do more than perform statistical calculations. It should also support:
- Automatic collection of shop-floor data
- Standard industrial communication protocols
- Transparent algorithms and traceable calculation logic
- Different statistical models
- Integration and collaboration with MES, QMS, and other systems
- Quality management throughout the process lifecycle
SPC software is no longer merely an analysis tool for the Quality Department. It is becoming an important component of enterprise-wide digital quality management.
How Does NexSPC Help Manufacturers Address the Evolving Requirements for SPC?
With the release of the new AIAG-VDA SPC Manual, expectations for SPC software continue to rise.
NexSPC continues to follow the development of relevant AIAG, VDA, and ISO standards while improving its capabilities around real-world manufacturing applications.
NexSPC currently supports:
- Multiple SPC control charts, including variable, attribute, and specialized control charts
- Process capability analysis, including Cp, Cpk, Pp, and Ppk
- Non-normal data analysis and distribution fitting
- Measurement System Analysis (MSA)
- Real-time SPC monitoring and abnormality alarms
- AI-assisted abnormality analysis
- Browser-based access and real-time dashboards across multiple devices
- Automatic integration with MES, QMS, ERP, and equipment data sources
These capabilities help manufacturers move beyond simply identifying problems toward a more proactive approach to quality management and defect prevention.

Conclusion
The most significant change in the new AIAG-VDA SPC Manual is not the addition of a few control charts or the adjustment of several statistical metrics.
Its real significance lies in redefining the role of SPC.
SPC is not about generating an impressive Cpk report. It is about continuously reducing process variation and preventing quality risks.
As smart manufacturing and digital factories continue to evolve, SPC is moving beyond its traditional role as a statistical analysis tool and becoming an important foundation for end-to-end quality management.
If your company is planning to upgrade its SPC system or wants to understand how the new AIAG-VDA SPC Manual may affect actual production, contact NexSPC to discuss more scientific and efficient approaches to quality management.