














1. When Traditional Cpk No Longer Reflects Modern Manufacturing, You May Be Overestimating Your Process Capability
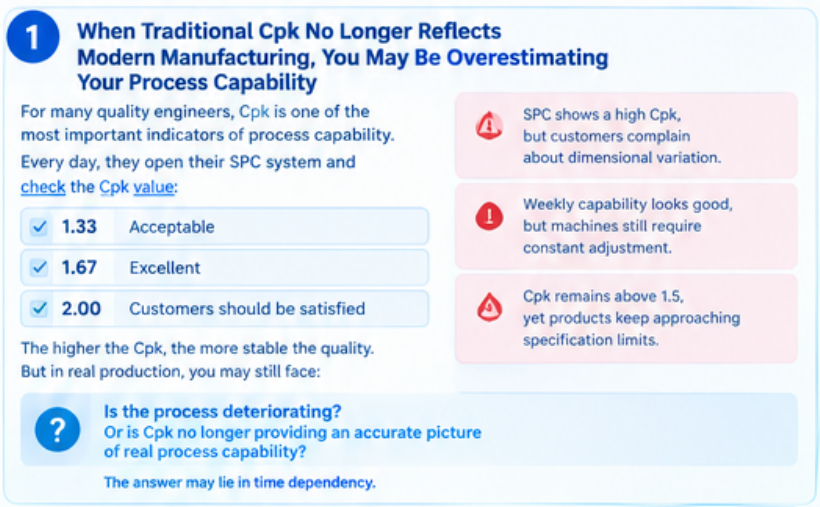
For many quality engineers, Cpk is one of the most important indicators of process capability.
Every day, they open their SPC system and check the Cpk value:
- 1.33 — Acceptable.
- 1.67 — Excellent.
- 2.00 — Customers should be satisfied.
It is easy to conclude that the higher the Cpk, the more stable the product quality.
But have you encountered any of these situations on the production floor?
- The SPC system reports a high Cpk, yet customers frequently complain about dimensional variation.
- Weekly capability analyses look good, but machine settings still require constant adjustment.
- Cpk remains above 1.5, while product measurements continue moving closer to the specification limits.
Is the process itself deteriorating? Or is Cpk no longer providing an accurate picture of actual process capability?
The answer may lie in time dependency: your process has developed time-related correlations that traditional Cpk does not account for.
2. A Fundamental Assumption Behind Traditional Cpk Is Often Overlooked
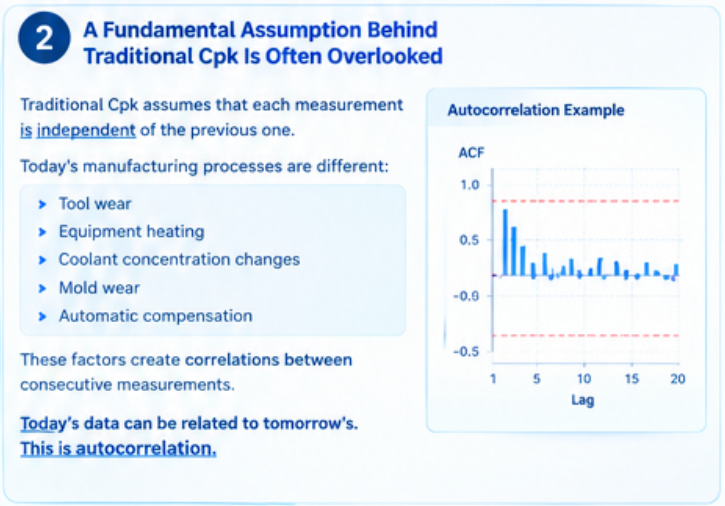
Traditional Cpk relies on an important statistical assumption: individual measurements are independent of one another.
In other words, today's measurement should not be influenced by yesterday's measurement, and one product should not affect the next.
This assumption was often reasonable for many processes in the past. However, modern smart manufacturing has changed the situation.
Many manufacturing processes evolve continuously over time due to factors such as:
- Progressive tool wear
- Gradual equipment heating
- Changes in coolant concentration
- Progressive mold wear
- Continuous automatic equipment compensation
These factors can introduce correlations between consecutive measurements.
Today's measurement may be related to the next one. In statistics, this phenomenon is known as autocorrelation.
3. Why Time Dependency Can Make Cpk Look Better Than It Really Is
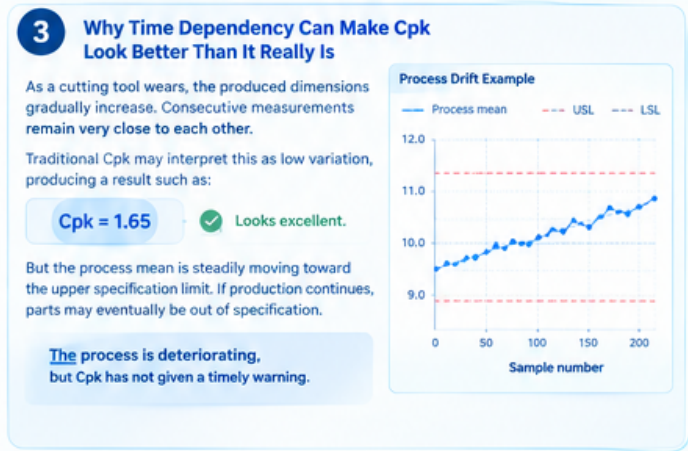
Consider a simple example.
As a cutting tool wears, the dimensions produced by a machining center gradually increase.
Because the change is gradual, consecutive measurements remain very close to one another.
Traditional Cpk may interpret this as low process variation, producing a result such as:
Cpk = 1.65
The result looks excellent.
However, the process mean is steadily moving toward the upper specification limit. If production continues without corrective action, the process may eventually produce out-of-specification parts.
In other words, the process is deteriorating, but Cpk has not provided a timely warning.
This explains why some manufacturers see impressive Cpk values while customer satisfaction continues to decline.
4. Cpk.g: A Capability Index for Time-Dependent Processes
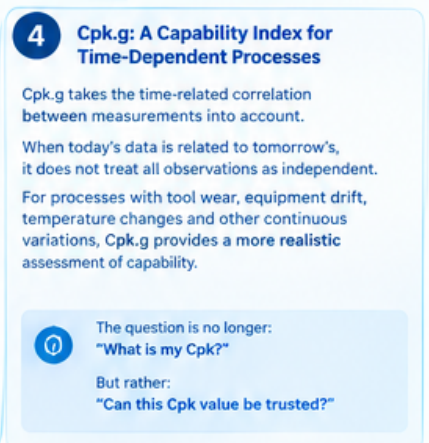
To address the limitations of traditional Cpk, more advanced statistical approaches use Cpk.g for capability analysis involving time-dependent processes.
The key difference is that Cpk.g takes the time-related correlation between measurements into account.
When today's process data is related to tomorrow's, the analysis does not simply treat every observation as an independent sample.
For processes affected by tool wear, equipment drift, temperature changes, and other continuous variations, Cpk.g can provide a more realistic assessment of process capability.
The question engineers need to ask is no longer just:
What is my Cpk?
It is also:
Can this Cpk value be trusted?
5. The ABCD Model: Classify the Process Before Choosing a Capability Analysis Method
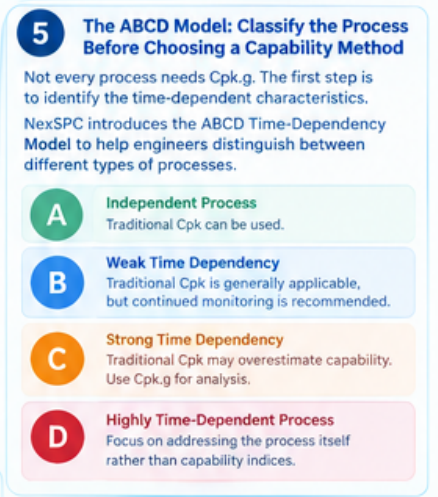
Not every manufacturing process requires Cpk.g.
The first step is to identify the process's time-dependent characteristics.
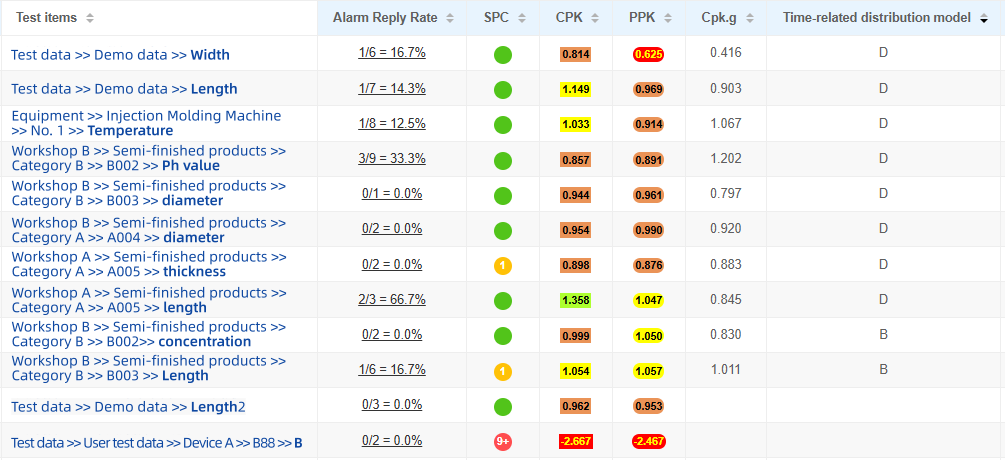
NexSPC SPC introduces the ABCD Time-Dependency Model to help engineers distinguish between different types of processes.
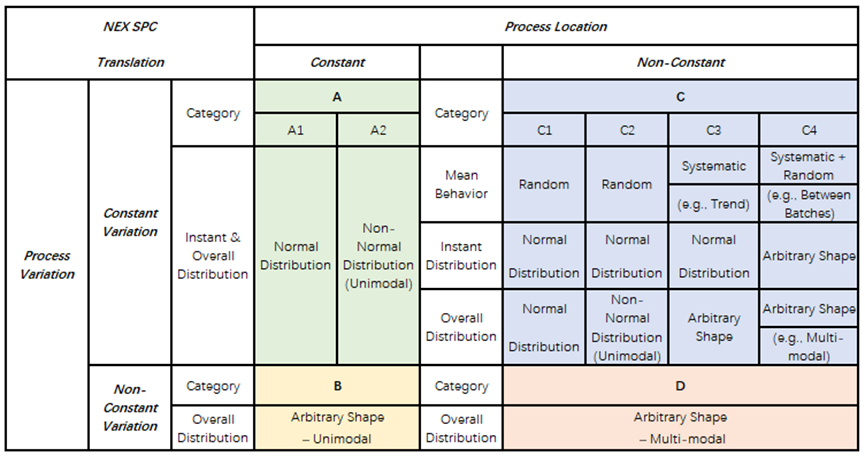
Category A: Independent Process
Measurements are statistically independent.
Traditional Cpk can be used directly.
Category B: Weak Time Dependency
Some time-related correlation exists, but its influence is limited.
Traditional Cpk may still be appropriate, although continued monitoring is recommended.
Category C: Strong Time Dependency
Measurements show significant correlation over time.
Traditional Cpk may overestimate actual process capability. Cpk.g is recommended for the analysis.
Category D: Highly Time-Dependent Process
The process has significantly deviated from the assumptions underlying conventional capability analysis.
Rather than continuing to focus on capability indices, engineers should prioritize investigating and addressing the process itself.
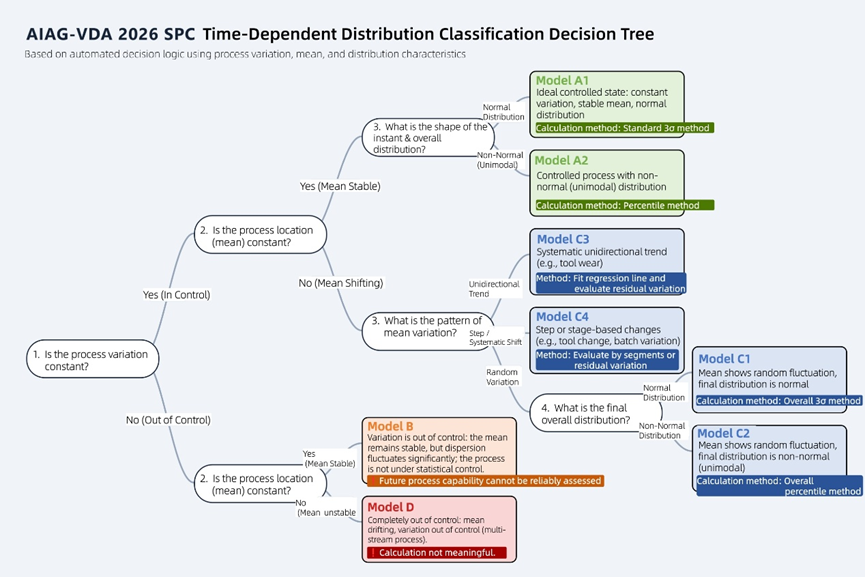
Related article: Understanding the ABCD Classification Logic in the New SPC Approach — Diagrams and Tables.
6. A Real-World Manufacturing Example
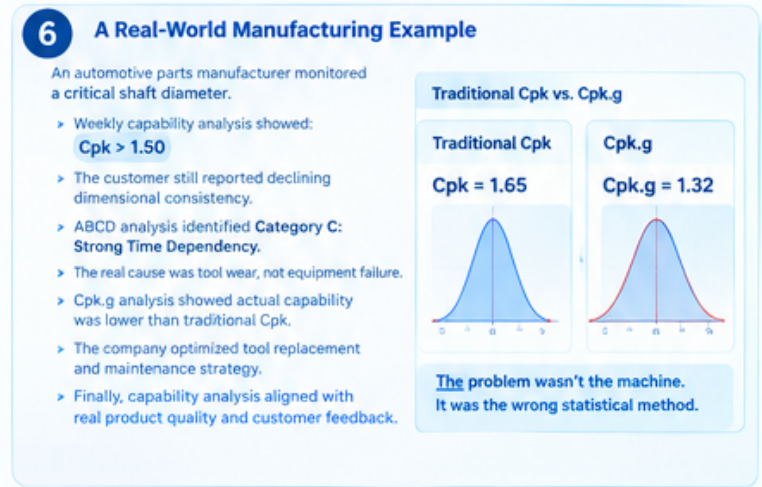
An automotive parts manufacturer had been monitoring a critical shaft diameter for an extended period.
Weekly capability analyses consistently showed:
Cpk above 1.50
On paper, the production line appeared to be performing very well.
However, the customer continued to report declining dimensional consistency.
Using the ABCD Time-Dependency Analysis in Bingo SPC, engineers discovered that the process belonged to Category C: Strong Time Dependency.
The cause was not an equipment failure. It was progressive cutting tool wear.
Further analysis using Cpk.g revealed that actual process capability was significantly lower than the traditional Cpk calculation suggested.
The manufacturer then optimized its tool replacement intervals and adjusted its preventive maintenance strategy.
After these changes, the capability analysis became more consistent with actual product quality and customer experience.
The problem was not necessarily the machining equipment itself.
The problem was using a statistical method that was not appropriate for the process.
7. Why Modern Manufacturing Needs New Capability Analysis Methods
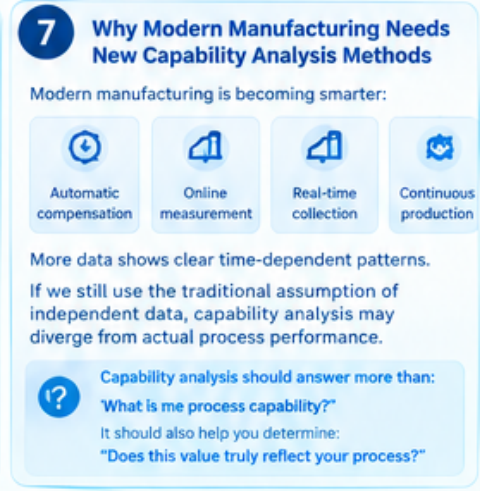
Manufacturing is becoming increasingly intelligent and automated.
Equipment performs automatic compensation. Measurements are collected online. Production runs continuously.
As a result, more manufacturing data exhibits distinct time-dependent patterns.
If manufacturers continue evaluating modern processes using the traditional assumption that measurements are independent, capability analysis may increasingly diverge from actual process performance.
Capability analysis should answer more than one question.
It should not only tell you:
What is the process capability?
It should also help you determine:
Does this capability value accurately reflect the process you are actually running?
8. NexSPC: Bringing Capability Analysis Closer to Real Manufacturing Conditions
NexSPC supports traditional Cpk and Ppk analysis, as well as advanced capability analysis designed for modern manufacturing environments.
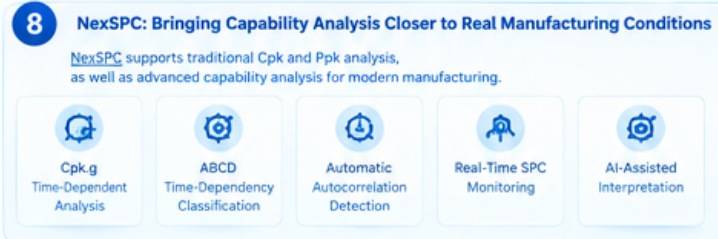
Key capabilities include:
- Cpk.g Time-Dependent Capability Analysis
- ABCD Time-Dependency Classification
- Automatic Autocorrelation Detection
- Real-Time SPC Process Monitoring
- AI-Assisted Statistical Interpretation
Rather than simply reporting a capability index, NexSPC helps engineers examine the statistical reliability behind the results, supporting more accurate quality assessments and better-informed engineering decisions.
Related article: NexSPC Officially Supports Cpk.g and the ABCD Time-Dependency Model
9. When Should You Use Cpk, and When Should You Use Cpk.g?
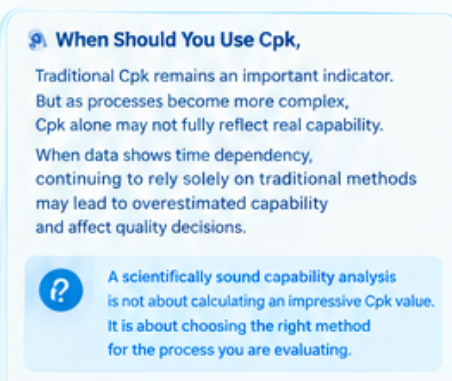
Traditional Cpk remains one of the most important indicators in quality management.
However, as manufacturing processes become more complex, Cpk alone may not fully reflect actual process capability.
When measurements exhibit time dependency, continuing to rely solely on traditional methods may lead to an overestimation of process capability and potentially affect quality decisions.
A scientifically sound capability analysis is not about calculating an impressive Cpk value. It is about choosing a statistical method that suits the process being evaluated.
Because meaningful quality improvement begins with understanding how the process actually behaves.